Hi guys,
how it is possible to get the simpliest chart for scriptable.
For Example 12 month with these orders:
255, 154, 165 , 85, 65 …
i know it is possible with DrawContent but i don’t get it.
Thank you.
Hi guys,
how it is possible to get the simpliest chart for scriptable.
For Example 12 month with these orders:
255, 154, 165 , 85, 65 …
i know it is possible with DrawContent but i don’t get it.
Thank you.
What kind of graph? For a column graph, look at my code here.

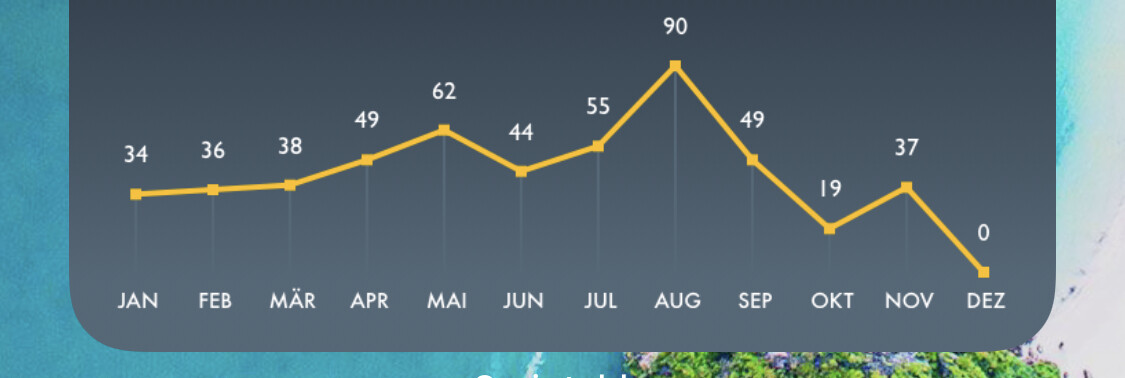
I got it work, but how i am able to show the value as text over each rectangle. An line graph would also be great.
So i got it to work. But one thing i am missing is to color the SFS Symbols. I know i am able to tint them when adding to a stack. But how to color them, when i draw the image to an rectangle with: drawImageInRect
How to color the symbol?
Hi, could you please share your code? Thanks!