Here’s some of my widgets:
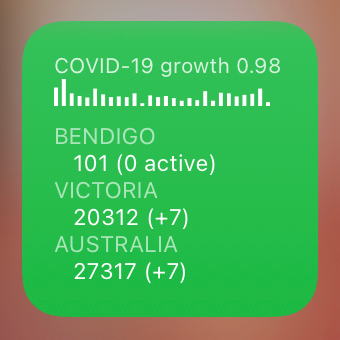
COVID-19 Cases widget using ABC data and providing local case numbers in Australia. Changes colour based on weekly growth rate and tap to show more data in a table view. Edit the source to change the local/state area. Users elsewhere might get some ideas for how to draw a column graph.

Sticky Note, a simple widget that includes tap to edit, dark mode support and file-based storage.
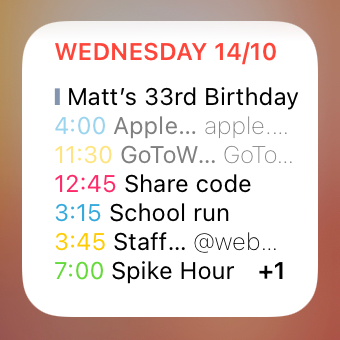
Calendar widget in the style of Things’ today view. If events don’t fit, it prioritises all-day over future over past events (which are greyed out) and indicates how many extra events are scheduled.