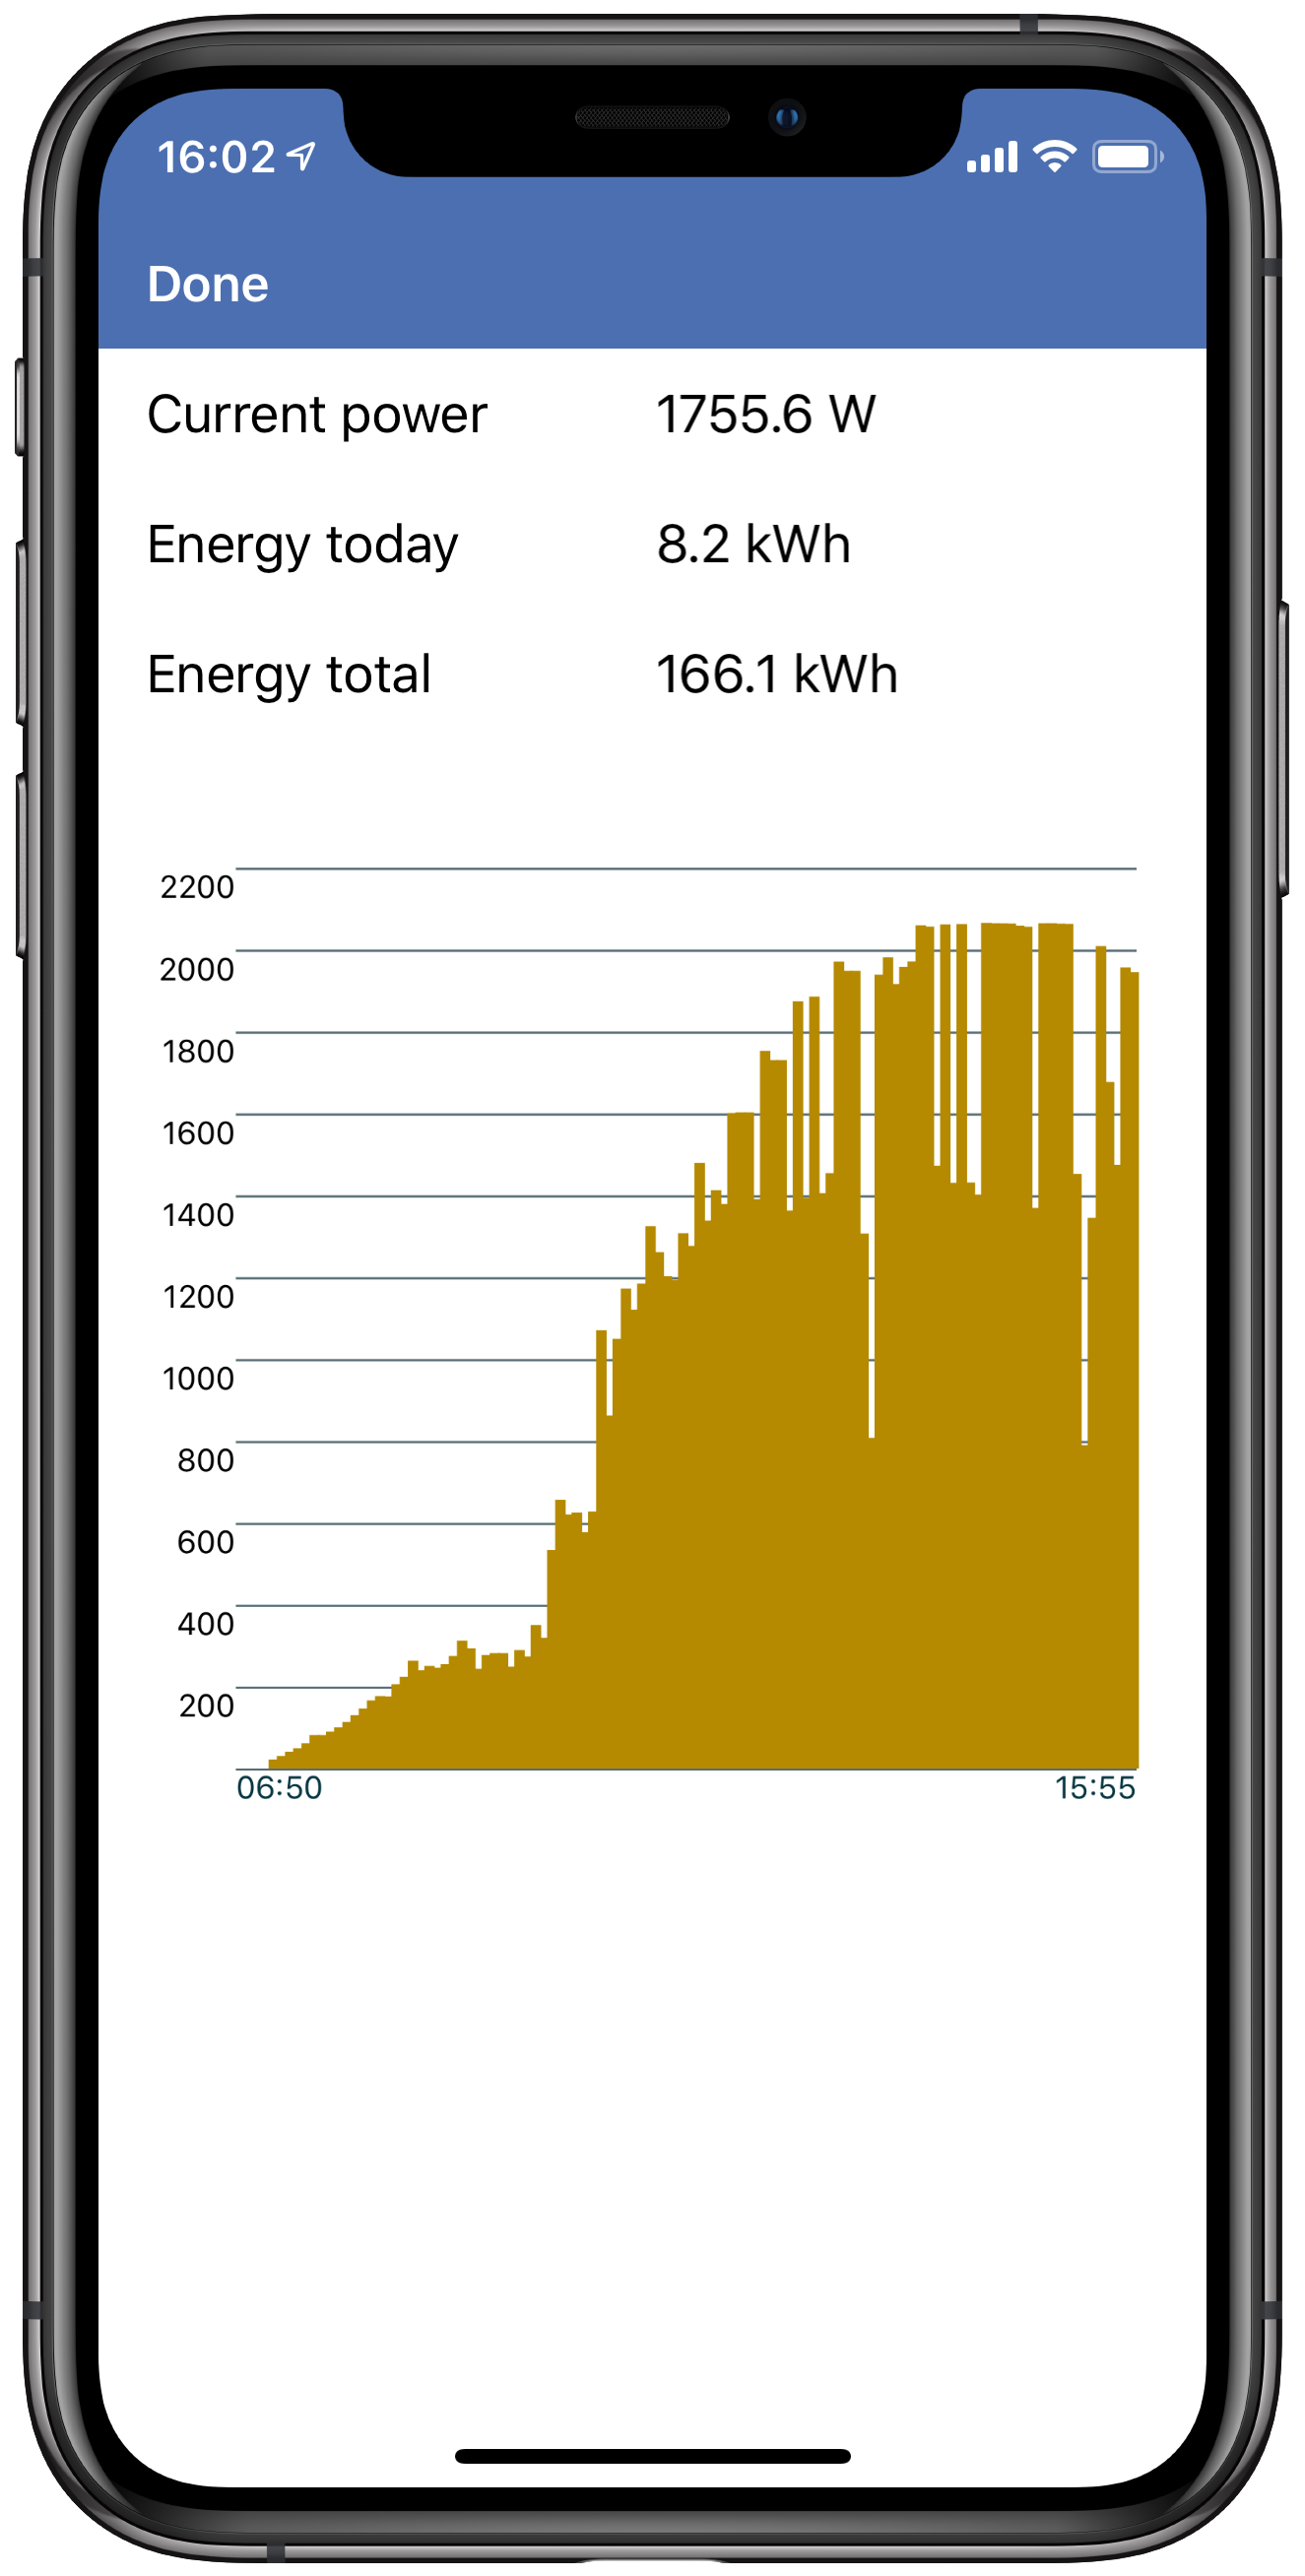
I made a small Scriptable script that captures some data from (the website for) my solar panels. The script currently shows the current power production, today’s energy production, and the total energy production. That’s nice, but it could be even better.
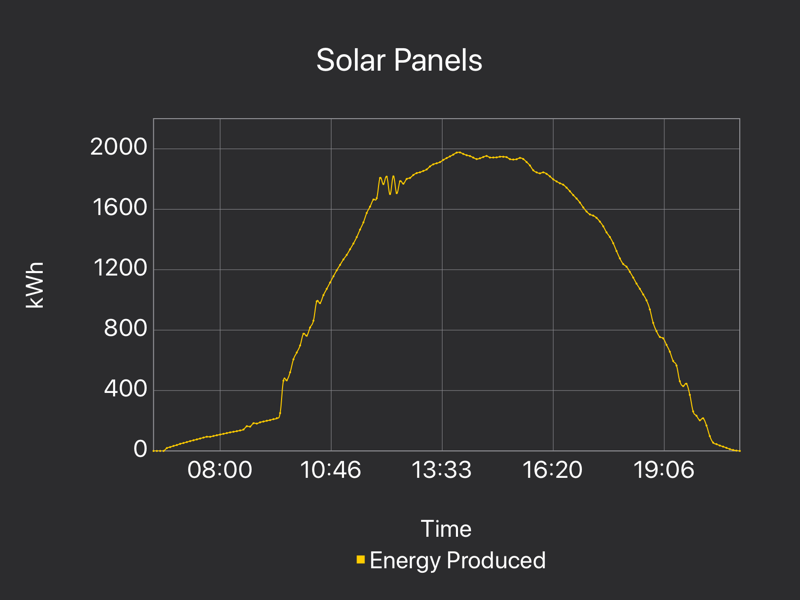
One of the API calls (also) returns an array of key-value pairs where the key is a timestamp (5 minutes apart) and the value is the power production at that time. It would be nice to use that to produce a graph of the production during the day (the native App for my inverter already does that, but the UI/UX of that App is not very nice).
Which graph module/library works with Scriptable? (If any)
There is the Google Charts library, but that only works in a browser which is no problem in Scriptable. But it is not native Scriptable and I don’t think that there is a graph library exclusively for Scriptable, but I can be wrong
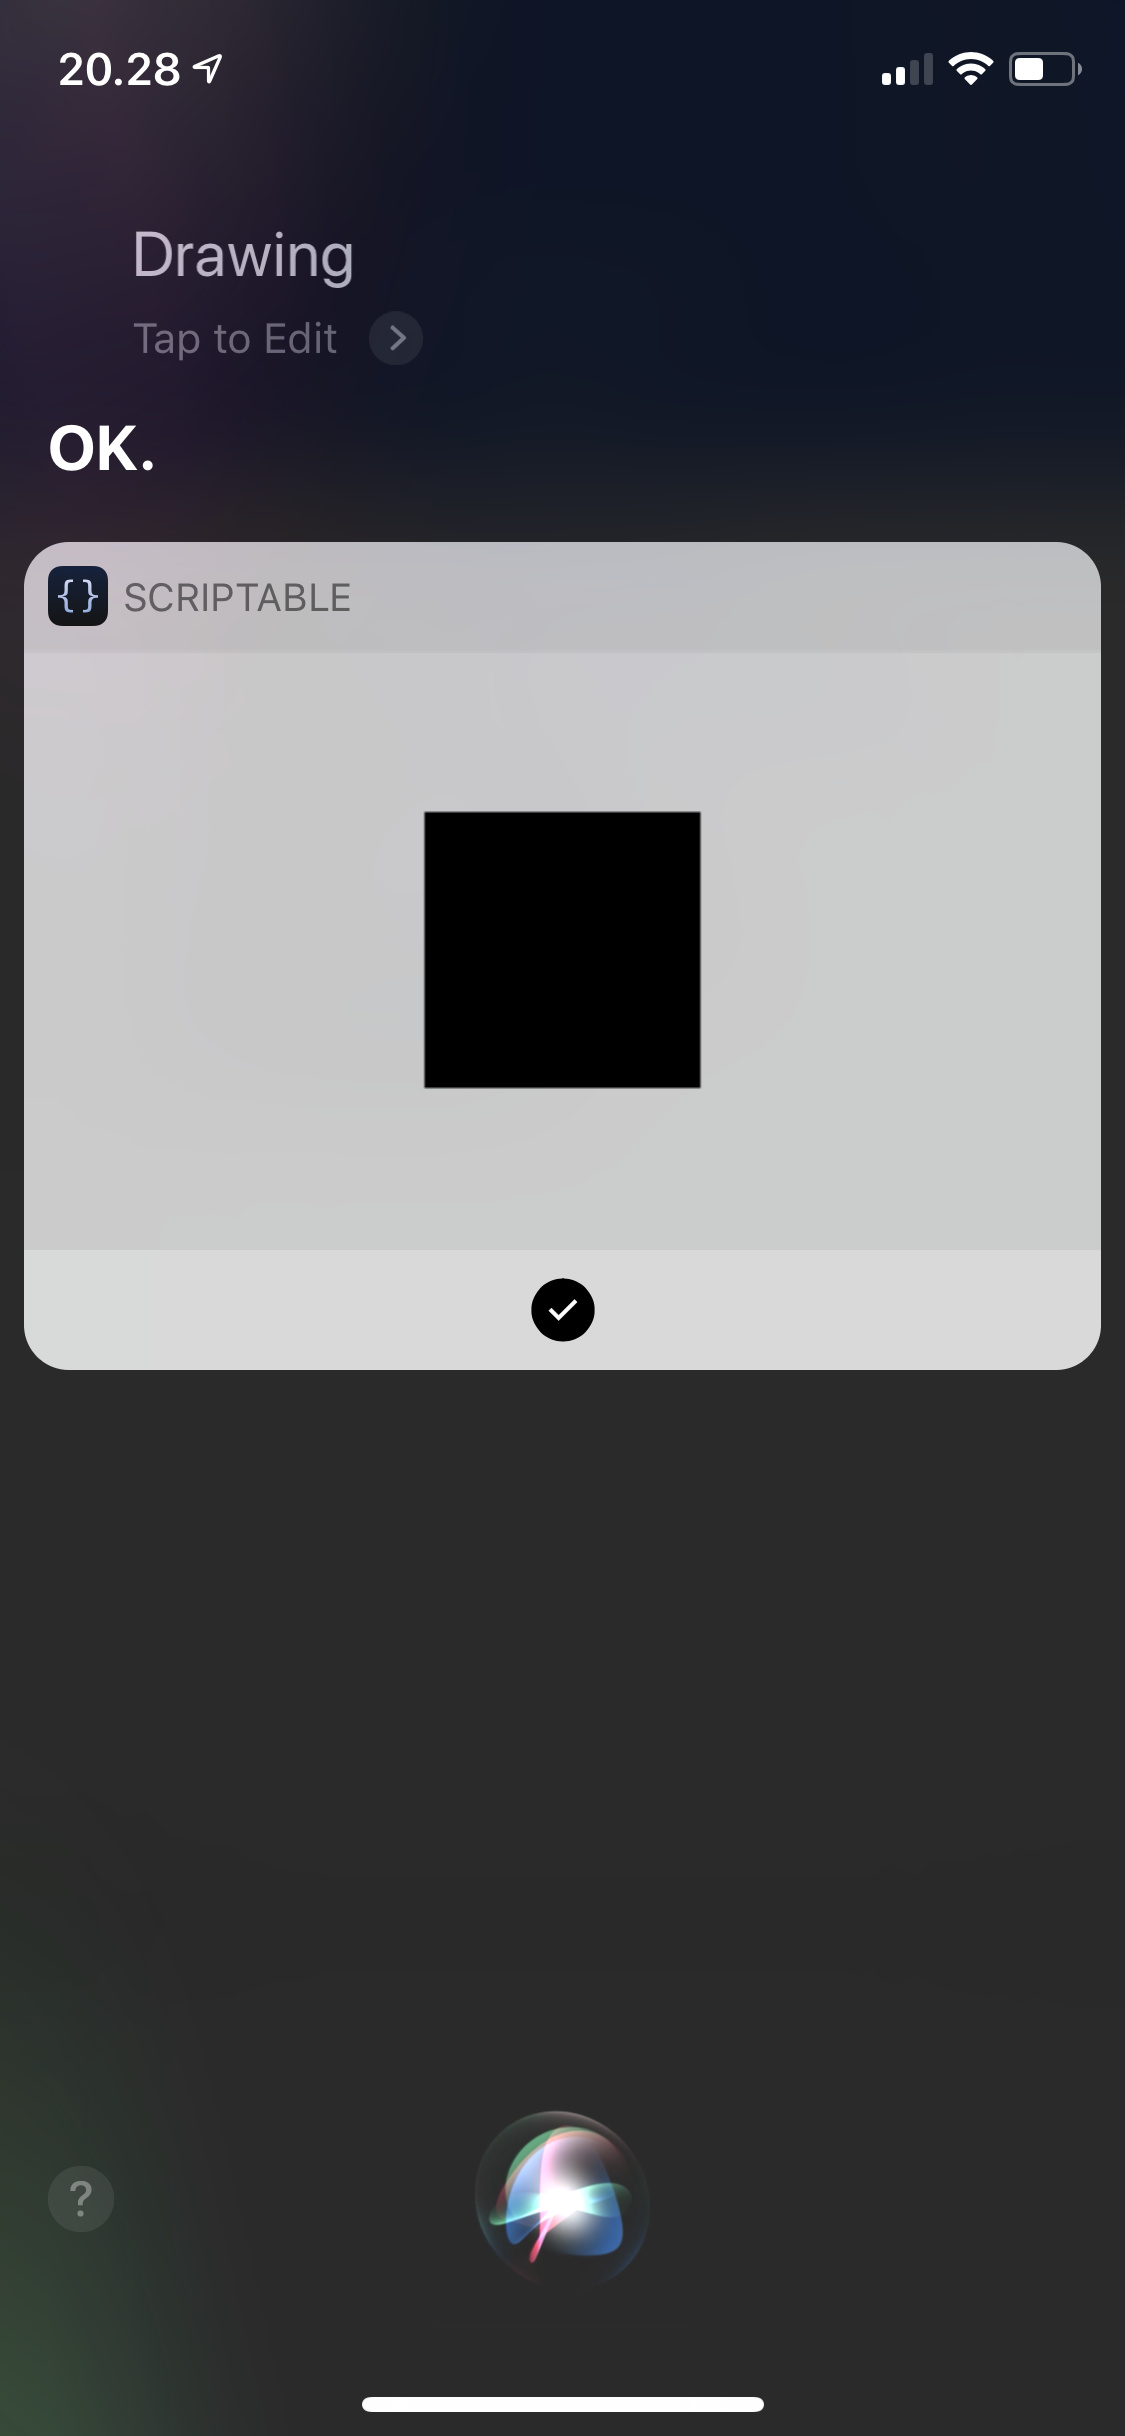
In order to render a transparent background, you’ll need to set context.opaque = false.
You should be able to center the image row.centerAligned(). Here’s a small sample script and a screenshot of the result.
let c = new DrawContext()
c.size = new Size(200, 200)
c.opaque = false
c.backgroundColor = Color.clear()
let rect = new Rect(50, 50, 100, 100)
c.fillRect(rect)
let img = c.getImage()
let table = new UITable()
let row = new UITableRow()
row.height = 200
let cell = row.addImage(img)
cell.centerAligned()
table.addRow(row)
await table.present()
https://quickchart.io/ works well with Scriptable. I used their charts it in my Scriptable “Pomodoro logger” (that writes completed work sessions into an outlook calendar) to visualise some productivity statistics. Their charts can be combined with UITables, too.
The only drawback is the internet/site dependency. But it’s the best we can do at the moment I guess.
Edit: And the fact that the amount of data / chart style is limited by URL length limits.


 Sorry for the inconvenience.