Charty, the best way to create charts from Shortcuts

Hello everyone!

If you’ve been following r/Shortcuts, you might have already seen this, but on May 6, I’ve released Charty!

Charty is a new Shortcut Utility App aimed at creating charts directly from Shortcuts. It supports 5 different series types: Bar, Line, Scatter, Pie and Donut. And adds 11 powerful new actions to Shortcuts including New Chart, Add Series To Chart, Copy Chart To Clipboard and more.

It’s free with limited features. An in-app purchase unlocks extra actions, icons, chart customisation and more. This IAP is discounted at $2.99 until June 8 :slight_smile:

I’ve tried to make the process of learning Charty as easy as possible, with a video tutorial and 27 example shortcuts in the app. On the website, you can also find 14 extra examples, tutorials and a FAQ.

Here are some examples of what it can do:

Let me know how you’re liking it and what you’ve been creating!

4 Likes

Unfortunately I was not able to test/use it very much during the beta (did you remove it from TestFlight?), but yesterday I was finally able to make a graph using my own data. Bought the Premium features to finetune the result and I’m pretty pleased with what Charty can do:

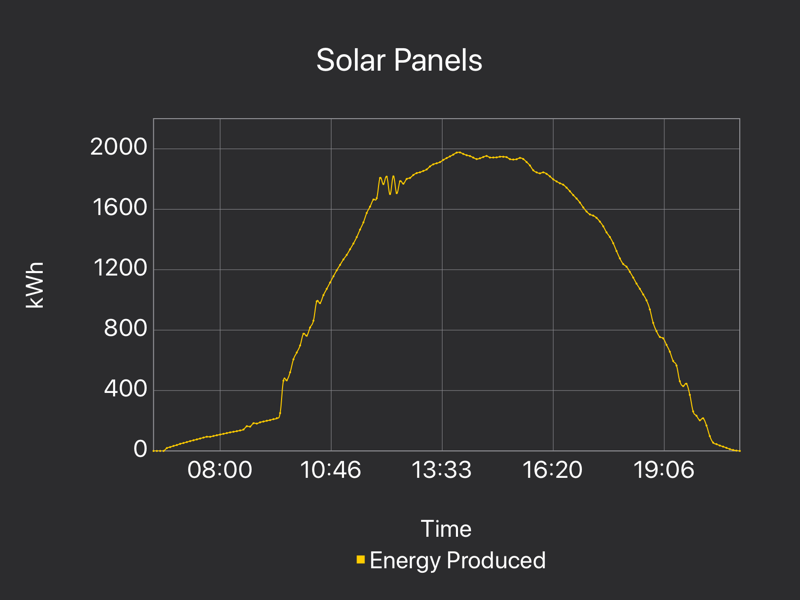
(Solar panel production; data obtained via HTTPBot and manually modified to be suitable for Charty - considering to automate that)

@rodrigoaraujo Would you consider an option to fill the area below the line with a solid color? (To make it look like this)

EDIT: Oh, I can use the same trick as in Scriptable for that: use a Bar graph

EDIT 2: In the mean time I discovered I can set the granularity to hours on the X-axis, but I don’t understand what values I need to enter for min/max if I want the graph to start at 6:00 and end at 22:00. How can I do this?

Hello there!

I’m looking into adding area charts to the next release! In the meantime, the bar chart trick works pretty well :blush:
The best way to set the min and max using date values would be to create date objects in your shortcut and pass them on the min and max value in the Style Axis action like this:
https://www.icloud.com/shortcuts/6f4259e106b34adc9cf3e77786f8dc98

Thanks! I just figured out it’s number of seconds since the Epoch. Was not sure how to do that, so thank you for this hint :slight_smile:

That was helpful.

Until today I never seriously played with Shortcuts, but your App made it so much fun! Thank you for creating this.

I created a shortcut that logs in to the production website of my solar panels, fetches the production data for today, and displays this in a graph that is copied to the clipboard (and thus easy to post here). Fully automated; just have to start the shortcut :slight_smile:

2 Likes

And then I realized I could create a shortcut that opens a notification that shows the total production for today as text with this chart as a small embedded image (where tapping that thumbnail would show the full chart)…

Using Shortcut’s automation I can even run that shortcut 15 minutes after sunset every day.

This would be perfect, if not for the fact that I don’t immediately get this notification, but first a (execute shortcut) notification that I have to tap to execute this shortcut…

Any way to prevent that intermediate step?

EDIT: No… https://support.apple.com/guide/shortcuts/apd602971e63/ios

We have hopes for iOS 14.

1 Like