Hi all. I found myself wanting to know the next few high and low tides at a particular location. I couldn’t find a shortcut or widget that did what I wanted, so I made one. I thought I’d post it for anyone else who might be interested.
I built it by modifying an existing widget that showed covid rates by country (which I had saved as “getWebText”). Unfortunately, I don’t have a record of who wrote it — but a big thank-you to them!
I’ve set up (and commented) a variety of parameters as variables defined up high so they’re easy to change, including the NOAA tide station you use, the colors and the font sizes. The URL to look up tide station identifiers is also in a comment.
Unfortunately, I think NOAA only provides U.S. tide predictions.
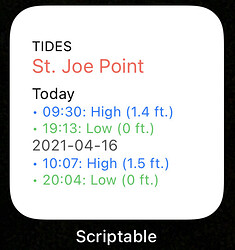
Here’s what it looks like:
Here’s the code for the widget — enjoy!
// Variables used by Scriptable.
// These must be at the very top of the file. Do not edit.
// icon-color: deep-green; icon-glyph: user-md;

// by T. Francis (theofrancis@gmail.com)
// adapted from "getWebText" covid monitoring script/widget
// modify ==> items for easy customization

// ==> change "stationID and "stationName"
// to a station number and name from
// https://www.tidesandcurrents.noaa.gov/tide_predictions.html

// examples:
// • "8728958" "St. Joe Point"
// • "9451439" "Petersburg, Alaska"
const stationID = "8728958"
const stationName = "St. Joe Point"

// ==> set colors
// background color
const bkgdColor = Color.black()
// tide colors
const highColor = Color.blue()
const lowColor = Color.green()
// heading colors
const flashColor = Color.white()
const stationColor = Color.blue()
const todayColor = Color.white()
const dateColor = Color.gray()

// ==> set font sizes
const flashSize = 10
const stationSize = 14
const dateSize = 11
const lineSize = 10

// ==> set rounding for tide heights
// (number of decimal places to round to)
const roundPlaces = 0

// ==> set test to true to use the test data while modifying the widget or app, to avoid hitting the API unnecessarily
var test = false;

// generate dates (defaults to today & tomorrow)
const today = new Date()
let currentDate = new Date();
let cDay = addLeadingZeros(currentDate.getDate())
let cMonth = addLeadingZeros(currentDate.getMonth() + 1)
let cYear = currentDate.getFullYear()
let cDateFmt = cYear+"-"+cMonth+"-"+cDay
let cDateTod = cYear+""+cMonth+""+cDay
let cDateTom = cYear+""+cMonth+""+(cDay+1)

// create api query url with station id and dates
const url = `https://api.tidesandcurrents.noaa.gov/api/prod/datagetter?product=predictions&application=NOS.COOPS.TAC.WL&begin_date=${cDateTod}&end_date=${cDateTom}&datum=MLLW&station=${stationID}&time_zone=lst_ldt&units=english&interval=hilo&format=json`
console.log(url)

// load live data unless in test mode
if (test == false) {
  const req = new Request(url)
  var res = await req.loadJSON()
}
else {
  res = {"predictions":[{"t":"2021-04-13 01:52","v":"0.797","type":"H"},{"t":"2021-04-13 04:01","v":"0.701","type":"L"},{"t":"2021-04-13 08:49","v":"1.156","type":"H"},{"t":"2021-04-13 17:31","v":"0.092","type":"L"},{"t":"2021-04-14 09:00","v":"1.308","type":"H"},{"t":"2021-04-14 18:24","v":"0.029","type":"L"}]}
}

// create widget or run within Scriptable

if (config.runsInWidget) {
  // create and show widget
  let widget = createWidget(stationName, createPredictions(), bkgdColor)
  Script.setWidget(widget)
  Script.complete()
} else {
  console.log(createPredictions())
  // make table
  let table = new UITable()

  // add header
  let row = new UITableRow()
  row.isHeader = true
  row.addText(`Next tides for ${stationName}`)
  table.addRow(row)

  // fill data
  for (p in res.predictions) {
    if(res.predictions[p]["type"]=="H"){
      var ttype = "High"
    }
    else {
      var ttype = "Low"
    }
    console.log(res.predictions[p])
    table.addRow(createRow(ttype, res.predictions[p]["t"]))
  }

  if (config.runsWithSiri)
    Speech.speak(`The next ${res.predictions[0]["type"]} tide is at ${res.predictions[0]["t"]}.`)

  // present table
  table.present()
}

// create list of lists used by widget
function createPredictions() {
  var result = ""
  var datetime = ""
  var ddate = ""
  var height = ""
  lines = []
  // make components more user friendly
  for (p in res.predictions) {
    // H/L to High/Low (tide)
    if(res.predictions[p]["type"]=="H"){
      var ttype = "High"
    }
    else {
      var ttype = "Low"
    }
    // split data and time
    datetime = res.predictions[p]["t"]
    ddate = datetime.split(" ")[0]
    // replace today's date with "Today"
    if (ddate == cDateFmt) {
      ddate = "Today"
    }
    ttime = datetime.split(" ")[1]
    height = res.predictions[p]["v"]
    height = Math.round(height * (10^roundPlaces))/(10^roundPlaces)
    // create day's entry to pass to widget
    let line = [ddate,ttime,ttype,height]
    lines.push(line)
  }
  return lines
}

function createRow(title, datetime) {
  let row = new UITableRow()
  row.addText(datetime)
  row.addText(title)
  return row
}

function addLeadingZeros(n) {
  if (n <= 9) {
    return "0" + n;
  }
  return n
}


function createWidget(pretitle, lines, color) {
  let w = new ListWidget()
  w.backgroundColor = bkgdColor
  // add Tides header
  let flash = w.addText("Tides")
  flash.textColor = Color.white()
  flash.textOpacity = 1
  flash.font = Font.systemFont(10)
  // add station name
  let preTxt = w.addText(pretitle)
  preTxt.textColor = Color.red()
  preTxt.textOpacity = 0.8
  preTxt.font = Font.systemFont(14)
  w.addSpacer(5)
  // add prediction lines
  var refDate = ""
  var txt = ""
  var dateHeader = ""
  for (line in lines) {
    if (lines[line][0] != refDate) {
      refDate = lines[line][0]
      dateHeader = w.addText(lines[line][0])
      if (lines[line][0] == "Today") {
        dateHeader.textColor = todayColor
      }
      else {
        dateHeader.textColor = Color.gray()
      }
      dateHeader.font = Font.systemFont(11)
    }
    let txt = "• " + lines[line][1] + ": " + lines[line][2] + " (" + lines[line][3] + " ft.)"
    let text = w.addText(txt)
    if (lines[line][2] == "High") {
      text.textColor = highColor
    }
    else {
      text.textColor = lowColor
    }
    text.font = Font.systemFont(10)
  }
  return w
}


