Just playing around with Scriptable to create a Gantt chart using Google Charts and Calendar Events.
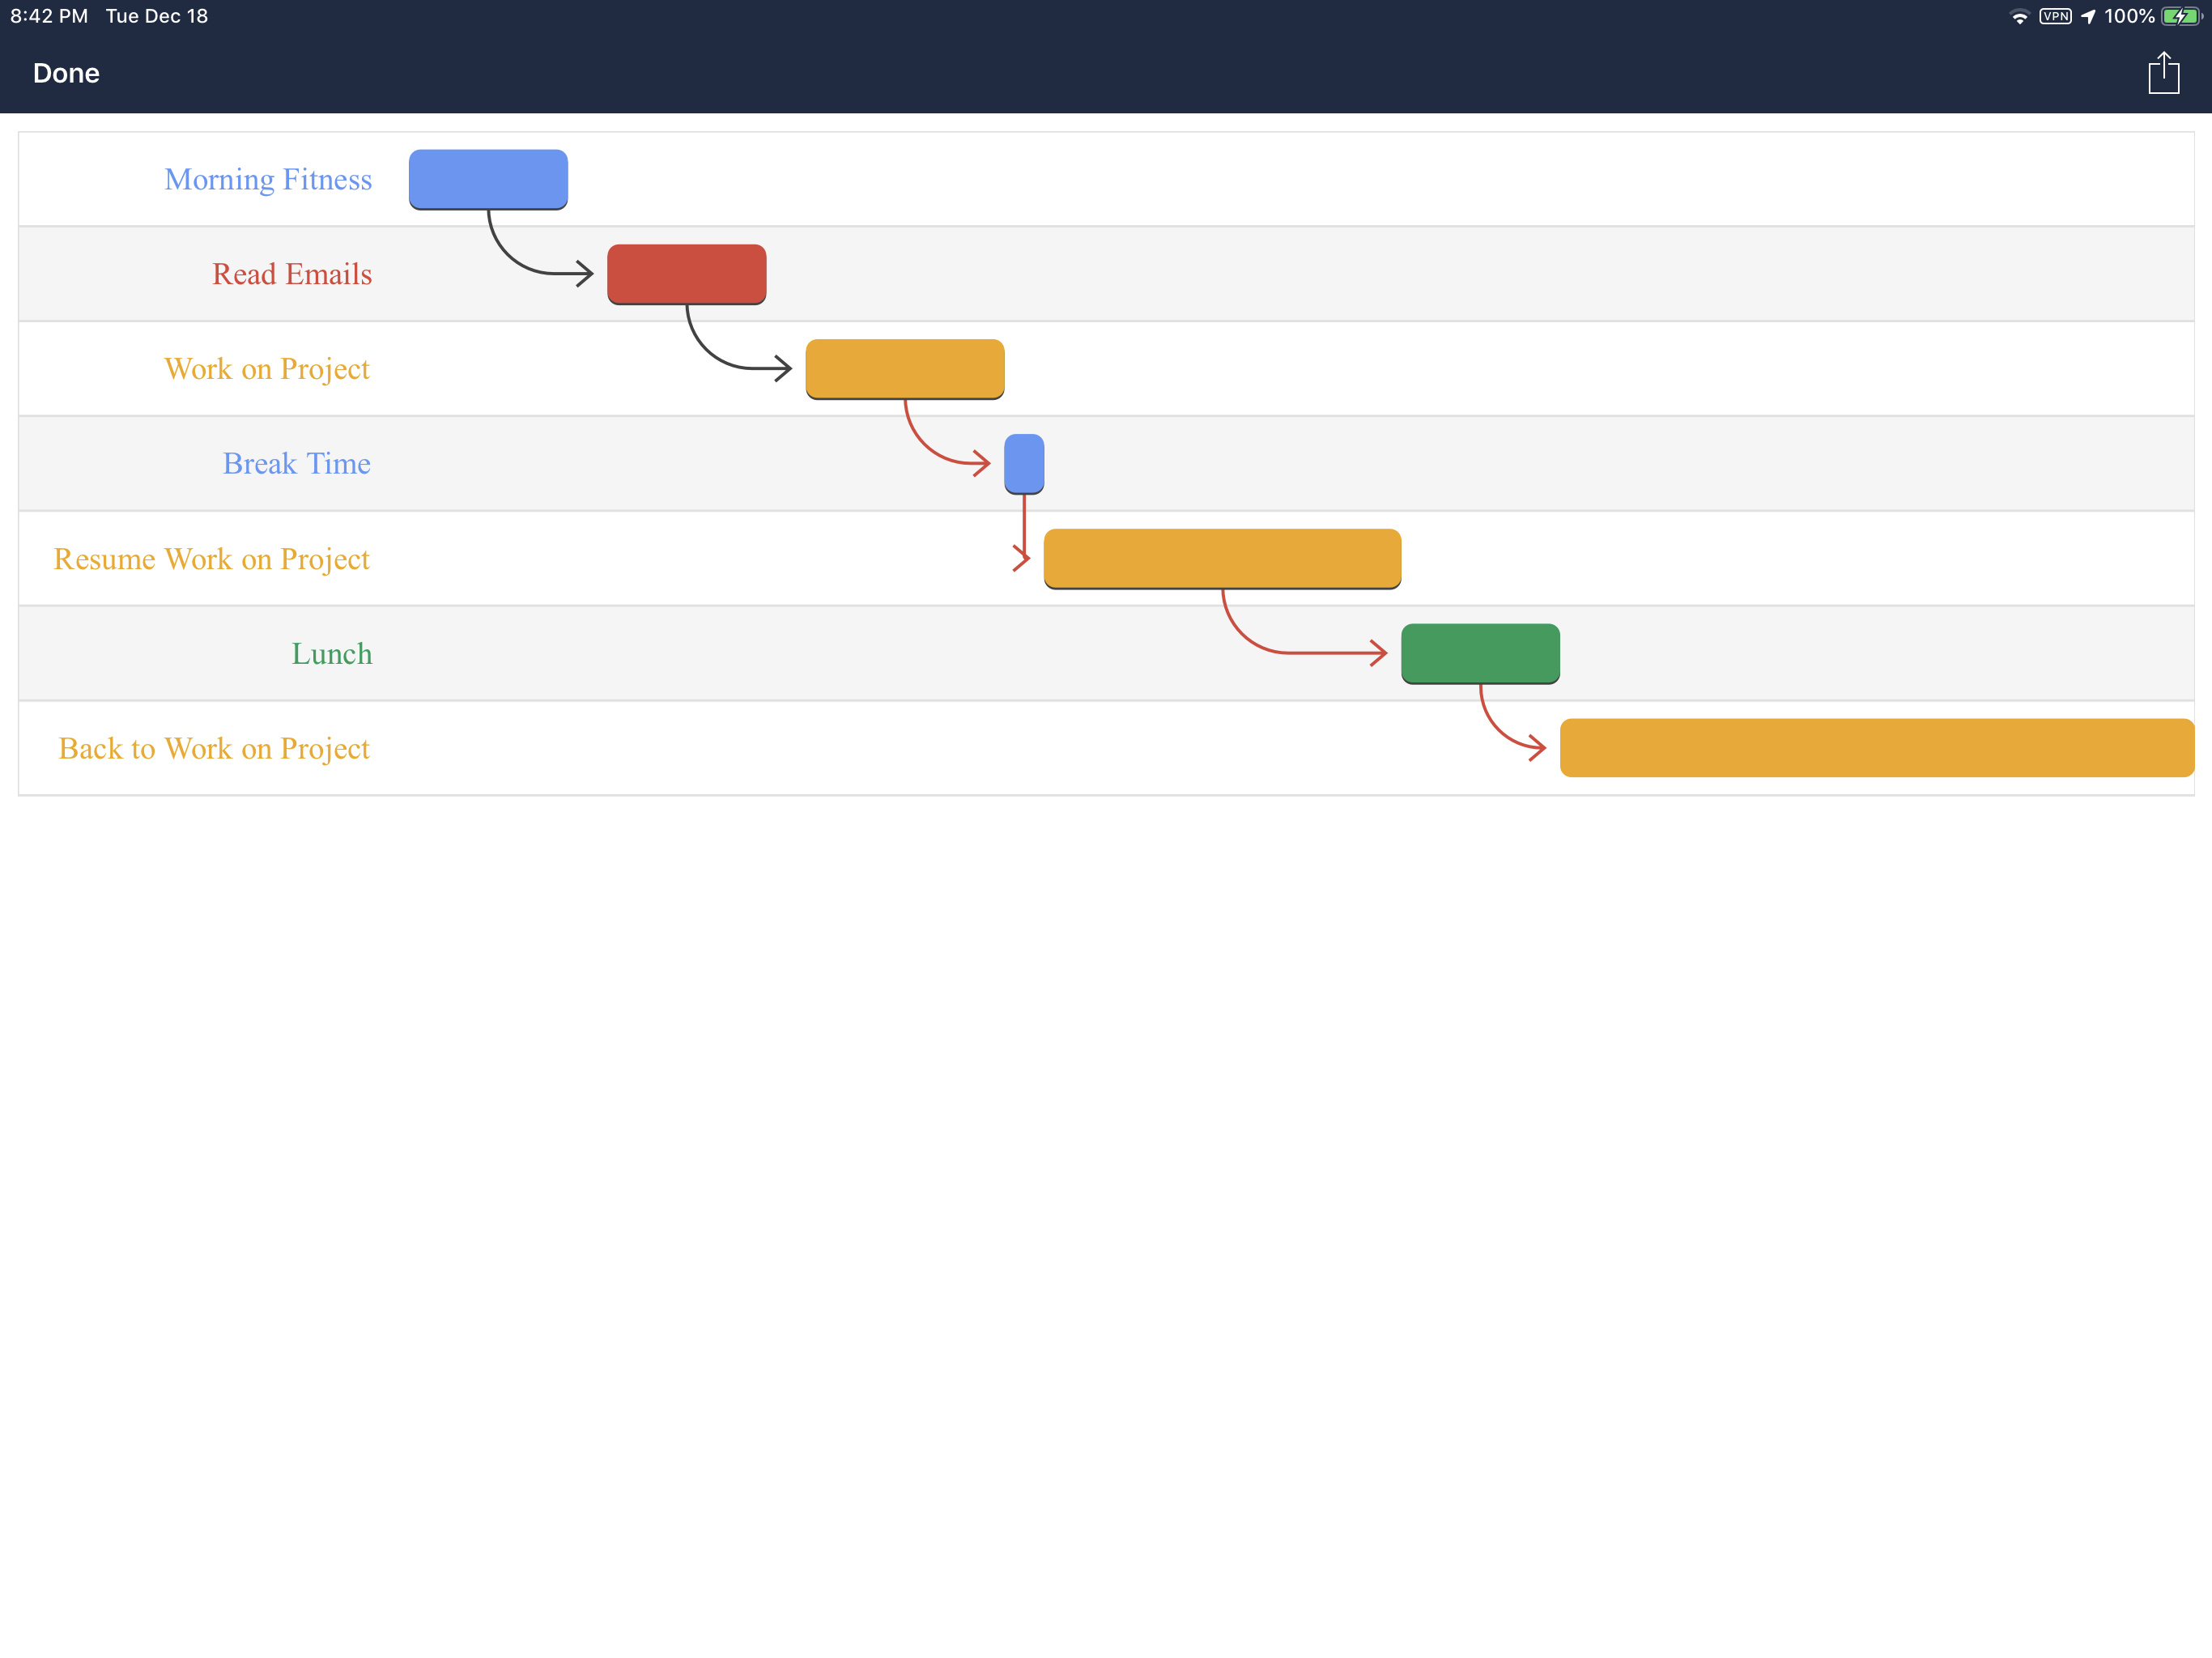
Here’s the script:
// Which Calendar
let calendarName = "Work"
let cal = await Calendar.forEventsByTitle(calendarName)
// Get events for a specific day
let events = await CalendarEvent.between(new Date(2018, 11, 24), new Date(2018, 12, 25), [cal])
// write the html code for everything except the Row Data see https://developers.google.com/chart/interactive/docs/gallery
// for chart examples and html
let html = "<html><head>" +
"<script type=\"text/javascript\" src=\"https://www.gstatic.com/charts/loader.js\"></script>" +
"<script type=\"text/javascript\">" +
"  google.charts.load('current', {'packages':['gantt']});" +
"  google.charts.setOnLoadCallback(drawChart);" +
" function drawChart() {" +
"    var otherData = new google.visualization.DataTable();" +
"    otherData.addColumn('string', 'Task ID');" +
"    otherData.addColumn('string', 'Task Name');" +
"    otherData.addColumn('string', 'Resource');" +
"    otherData.addColumn('date', 'Start');" +
"    otherData.addColumn('date', 'End');" +
"    otherData.addColumn('number', 'Duration');" +
"    otherData.addColumn('number', 'Percent Complete');" +
"    otherData.addColumn('string', 'Dependencies');" +
"    otherData.addRows(["

// here, we build the Row Data: ['Task ID', 'Task Name', 'Resource', Start, End, null, 0, 'Dependencies']
// where Task ID is the Event Title
//       Task Name is the Event Title
//       Resource is from the Event Notes (resource:dependency)
//       Start is built from the Event Start date/time parts
//       End is built from the Event End date/time parts
//       Duration is automatically calculated from the Start and End properties when set to null
//       Percent Complete isn't used, so it's set to 0
//       Dependencies, only one in this example, is from the Event Notes (resource:dependency)
let rows = 0
for (event of events) {
  if (!event.isAllDay) {
    rows = rows + 1
    // The Event Notes were used to "encode" a resource and dependency in the form of resource:dependency
    // Resources are used to color the bars
    // Dependency is the Event Title of the parent Event...the event that this event is dependant upon...use resource:None
    //   for no dependency
    let resource = event.notes.split(":")[0];
    let dependsOn = event.notes.split(":")[1];
    dependsOn = (dependsOn == "None" ? "null" : "'" + dependsOn + "'")
    html = html + (rows > 1 ? "," : "") +
        "['" + event.title + "','" + event.title + "','" + resource +
        "', new Date(" + (event.startDate.getYear() + 1900) + "," +
        event.startDate.getMonth() + "," +
        event.startDate.getDate() + ","  +
        event.startDate.getHours() + "," +
        event.startDate.getMinutes() +
        "), new Date(" + (event.endDate.getYear() + 1900) + "," +
        event.endDate.getMonth() + "," +
        event.endDate.getDate() + ","  +
        event.endDate.getHours() + "," +
        event.endDate.getMinutes() + "), null, 0, " + dependsOn + "]"
    }
  }

  // write the rest of the html
  html = html + "]);" +
  "var options = {" +
  "  height: 300" +
  "};" +
  "var chart = new google.visualization.Gantt(document.getElementById('chart_div'));" +
  "chart.draw(otherData, options);" +
  "}" +
"</script>" +
"</head>" +
"    <body>" +
"      <div id=\"chart_div\"></div>" +
"    </body>" +
"</html>"

// show off your work!
WebView.loadHTML(html, null, new Size(0, 300))