Hello,
I am looking for an example to create a Chart. (XY-Plot)
does anyone have a sample code.
THX
Westcliff
Hello,
I am looking for an example to create a Chart. (XY-Plot)
does anyone have a sample code.
THX
Westcliff
Do you have Charty installed?
I just installed it 
Hi Martin,
can I embed Charty in scriptable?
THX
Matthias
Charty is designed to work with Shortcuts, not Scriptable. But Scriptable is designed to work with Shortcuts too, so you can go from Scriptable to Shortcuts to Charty.
You might be able to generate an image from Charty using Shortcuts and use that via Scriptable, but Charty is usually the end point.
you have a sample code for me ?
THX
Just to put it in context, drawContext will take a little bit of extra grappling as you are in effect coding in every element of the chart. It isn’t a framework for drawing charts but for drawing content in a more general sense.
I suspect that @Martin_Packer was previously just pointing you in the direction of something that was designed for drawing charts; just not drawing charts in Scriptable.
Right. That was my intent. I’d rather not be confecting a graphing engine myself. (Who am I kidding?) 
But:
thank you 
so I can try a Chart 
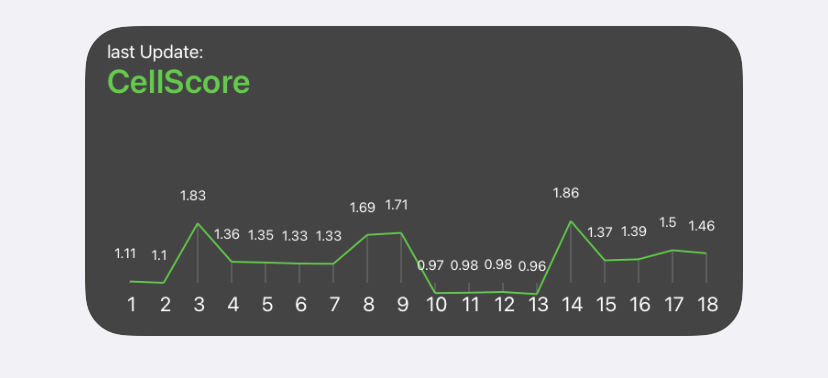
Glad you got it working I currently am using Quick Charts: https://quickchart.io/
It’s a free API (within generous limits) that returns the chart as an image based on your query. If anyone else finds this thread and is looking for other charting solutions.
hi, I am using it,but return the pictures obtained through url are not displayed in high definition proportionately. Is there any solution?
It is a rather tricky API to work with, there are a lot of options to set. But the documentation should get you there eventually. Here’s an example body from a POST request I’m using to generate a chart with it:
{
  height: 200,
  width: 500,
  chart: {
    type: 'horizontalBar',
    options: {
      legend: { display: false },
      scales: {
        yAxes: [
          {
            ticks: {
              mirror: true,
              fontSize: 24,
              beginAtZero: true,
              stepSize: 0.5,
            },
            gridLines: { display: false },
          },
        ],
      },
    },
    data: {
      labels: ['Label 1'],
      datasets: [
        {
          data: [0.97],
          backgroundColor: ['#1573ff80'],
          borderColor: ['#1573FF'],
          borderWidth: 1,
          categoryPercentage: 1,
          barPercentage: 0.95,
        },
      ],
    },
  },
};
I imagine that modifying the width and height will change the resolution, but I’m not sure