// These must be at the very top of the file. Do not edit.
// Variables used by Scriptable.
// Widget Params, default values for debugging
const widgetParams = JSON.parse((args.widgetParameter != null) ? args.widgetParameter : '{"UserName" : "For Steven" , "BirthDay" : "12/24/1956"}')
const widgetHeight = 400
const widgetWidth = 400
const widgetColor="243D52"
const yellowColor=new Color("FFFF00",1)
const greenColor=new Color("00FF00",1)
// TitleName
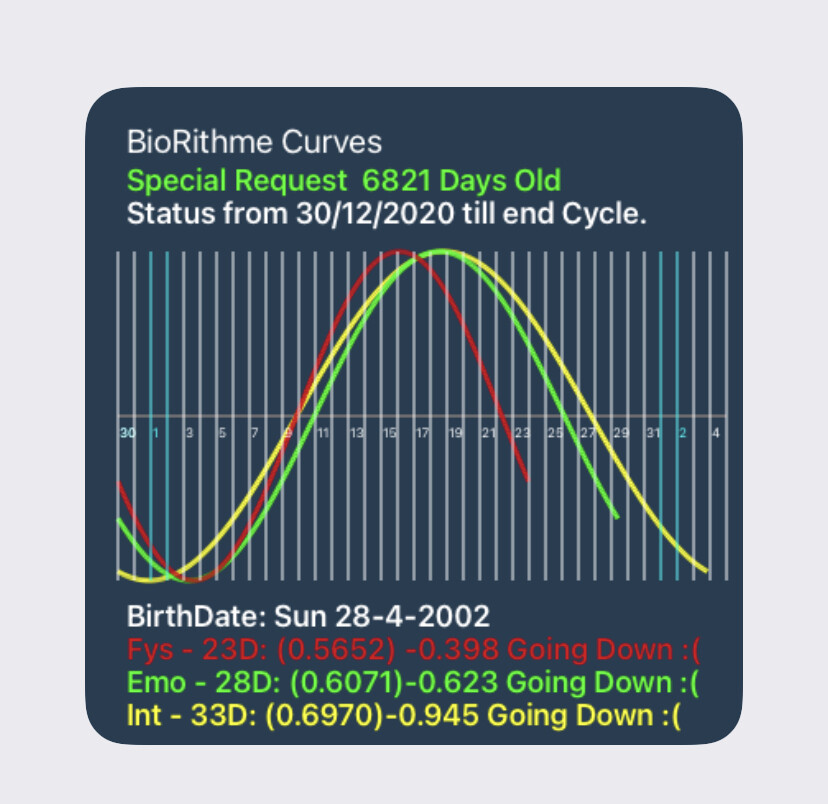
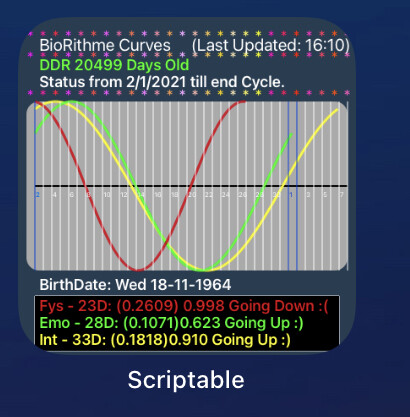
let TitleName ="BioRithme Curves"
const titleFontSize = 20
const titleFont = Font.systemFont(titleFontSize)
const titlePos = new Point(25, 20)
//Get UserName and BritDays from the Widget Parameter
let UserName = widgetParams.UserName
let BirthDay = widgetParams.BirthDay
const UserColor = new Color("#33cc33", 1)
if (config.runsInApp) {//
// if (UserName=="Request"){
let note = "mm/dd/yyyy"
BirthDay = await editData(note)
UserName = "Special Request "
// }
Script.complete()
}
// Used Fonts and WidgetLocation
const UserNameFontSize = 18
const UserNameFont = Font.semiboldSystemFont(UserNameFontSize)
let UserNameCoords = new Point(25, 45)
const YFontSize = 8
const YFont = Font.systemFont(YFontSize)
const YColor = Color.white()
let YCoords = new Point(ScaleH*s-25, 230)
//=======================================
// DateConstructions
const date1 = new Date(BirthDay)
var day = date1.getDate()
var month = date1.getMonth() + 1
var year = date1.getFullYear()
var BirthDate = day + "-" + month + "-" + year
var days = ["Sun","Mon", "Tue", "Wed", "Thu", "Fri", "Sat"]
var weekday = days[date1.getDay()]
const cd = new Date() //cd=CurrentDate
if (cd.getMonth()+1==13){Month=1}else{Month=cd.getMonth()+1}
let Day = cd.getDate()
let Str_Today= Month+"/"+Day+"/"+cd.getFullYear()
let SubT_Today= Day+"/"+Month+"/"+cd.getFullYear()
const date2 = new Date(Str_Today)
let DaysDiff= getDifferenceInDays(date1, date2)
//=======================================
//Drawing Line
DrawContext.prototype.drawLine = function (p_x1, p_y1, p_x2, p_y2, p_colourLine, p_intWidth)
{
let pthLine = new Path();
pthLine.move(new Point(p_x1, p_y1));
pthLine.addLine(new Point(p_x2, p_y2));
this.addPath(pthLine);
this.setStrokeColor(p_colourLine);
this.setLineWidth(p_intWidth);
this.strokePath();
}
//=======================================
// Set-up a small widget and drawing region
let wgtMain = new ListWidget();
wgtMain.setPadding(0, 0, 0, 0);
wgtMain.backgroundColor = new Color(widgetColor)
let dcRegion = new DrawContext();
dcRegion.size = new Size(widgetWidth, widgetHeight)
dcRegion.opaque = false
// Widget Title
drawTextP(TitleName , titlePos, Color.white(), titleFont)
// User Name
dcRegion.setTextAlignedLeft()
UserName=UserName + " " + DaysDiff + " Days Old "
drawTextP(capitalize(UserName), UserNameCoords, greenColor, UserNameFont)
UserNameCoords = new Point(25, 65)
let SubTitle="Status from " + SubT_Today + " till end Cycle."
drawTextP(SubTitle, UserNameCoords, Color.white(), UserNameFont)
//=======================================
// BirtDay Info
InfoCoords = new Point(25, 310)
drawTextP("BirthDate: "+ weekday + " " +BirthDate, InfoCoords, Color.white(), UserNameFont)
//=======================================
// BioFigures
let f=DaysDiff/23-Math.floor(DaysDiff/23)
InfoCoords = new Point(25, 330)
drawTextP("Fys - 23D: ("+ f.toFixed(4)+ ") "+ await BioInfo(f), InfoCoords, Color.red(), UserNameFont)
let e=DaysDiff/28-Math.floor(DaysDiff/28)
InfoCoords = new Point(25, 350)
drawTextP("Emo - 28D: ("+ e.toFixed(4)+ ")"+ await BioInfo(e), InfoCoords, greenColor, UserNameFont)
let i=DaysDiff/33-Math.floor(DaysDiff/33)
InfoCoords = new Point(25, 370)
drawTextP("Int - 33D: ("+ i.toFixed(4)+ ")"+ await BioInfo(i) , InfoCoords, yellowColor, UserNameFont)
//=======================================
//Draw X/Y Axes
dcRegion.drawLine(20, widgetWidth/2, 390, widgetWidth/2, Color.gray(), 2) //Hor
// dcRegion.drawLine(widgetWidth/2, 100, widgetWidth/2, 300, Color.gray(), 2) //Ver
var ScaleH=380 //widgetWidth
var ScaleV=widgetHeight/4 //100
var BseL=widgetHeight/2 //200 BaseLine (X-Axe) the half of the CanvasHeight
var x0,x1,y1,x2,y2,s
//=======================================
for (x0=1;x0<(ScaleH+1);x0++){
//=======================================
//Fys (23 Days)
//Calculate Rest of a Cycle
f=DaysDiff/23-Math.floor(DaysDiff/23)
//Set x1 & x2
await Set_x1x2()
await CalculateCoordinates(f,23)
await BioBase(23)
//Draw Sinus Wave
dcRegion.drawLine(x1+20, y1, x2+20, y2,Color.red(), 3)
//Draw Vertical each Quarter
//if (x1==ScaleH*s/4){
//dcRegion.drawLine(x1,BseL,x1,y1,Color.red(), 3)
//=======================================
//Emo (28 Days)
e=DaysDiff/28-Math.floor(DaysDiff/28)
await Set_x1x2()
await CalculateCoordinates(e,28)
await BioBase(28)
//Draw Sinus Wave
dcRegion.drawLine(x1+20, y1, x2+20, y2,greenColor, 3)
//=======================================
//Intel (33 Days)
i=DaysDiff/33-Math.floor(DaysDiff/33)
await Set_x1x2()
await CalculateCoordinates(i,33)
await BioBase(33)
//Draw Sinus Wave
dcRegion.drawLine(x1+20, y1, x2+20, y2,yellowColor, 3)
}
//=======================================
//Adding Calendar Grid
//Today
UserNameCoords = new Point(21, 205)
drawTextP(Day , UserNameCoords, Color.cyan(), YFont)
for (x0=0;x0<(ScaleH/10);x0++){
x1=x0*10
y1=100
x2=x0*10
y2=300
let nextDate = new Date()
nextDate.setDate(cd.getDate() + x0)
Day=nextDate.getDate()
let CalColor=Color.white()
//Mark the Beginning of the Month
if (Day<3){CalColor=Color.cyan()}
//Shift Grid : For Small or Big Presenetantion
dcRegion.drawLine(x1+20,y1,x2+20,y2,CalColor, 1)
if ((x0/2-Math.floor(x0/2))==0){
YCoords = new Point(x1+21, 205)
drawTextP(Day , YCoords, CalColor, YFont)
}
}
//=======================================
// Render the widget with the lines on it
//
wgtMain.backgroundImage = dcRegion.getImage()
if (!config.runsInWidget) await wgtMain.presentLarge()//.presentSmall();
Script.setWidget(wgtMain);
Script.complete();
//=======================================
// Returns the number of days between now and the provided date.
function getDifferenceInDays(date1, date2) {
const diffInMs = Math.abs(date2 - date1);
return Math.floor(diffInMs / (1000 * 60 * 60 * 24))
}
function drawTextP(text, point, color, font) {
dcRegion.setFont(font)
dcRegion.setTextColor(color)
dcRegion.drawText(new String(text).toString(), point)
}
function drawTextR(text, rect, color, font) {
dcRegion.setFont(font)
dcRegion.setTextColor(color)
dcRegion.drawTextInRect(new String(text).toString(), rect)
}
function capitalize(string) {
//UpperCase function
return string.replace(/\b\w/g, l=>l.toUpperCase())
}
function Set_x1x2() {
//Sets the X-Point
x1=x0-1
x2=x0
}
function BioBase(Bse) {
//Calculates the Horizontal scale based upon 400Points=35Days
s=Bse/35 //23,28,33 Days
x1=x1*s
x2=x2*s
}
function CalculateCoordinates(r,d){
//Calculation of the X/Y Coordinates
//Reverse the coordinate (-x), because the 0,0 coordinate is not Left-Under,but Left-Up
x1=x2-1
y1=Math.sin(-(x1/ScaleH+r)*2*Math.PI)*ScaleV + BseL
y2=Math.sin(-(x2/ScaleH+r)*2*Math.PI)*ScaleV + BseL
}
function BioInfo(y){
//Calculates the Progress for the next Days
const BioStat=Math.sin(y*2*Math.PI).toFixed(3)
let Info="Going Up :)"
if (y>=0.25&&y<=0.75){Info="Going Down :("}
Info = BioStat + " " + Info
return Info
}
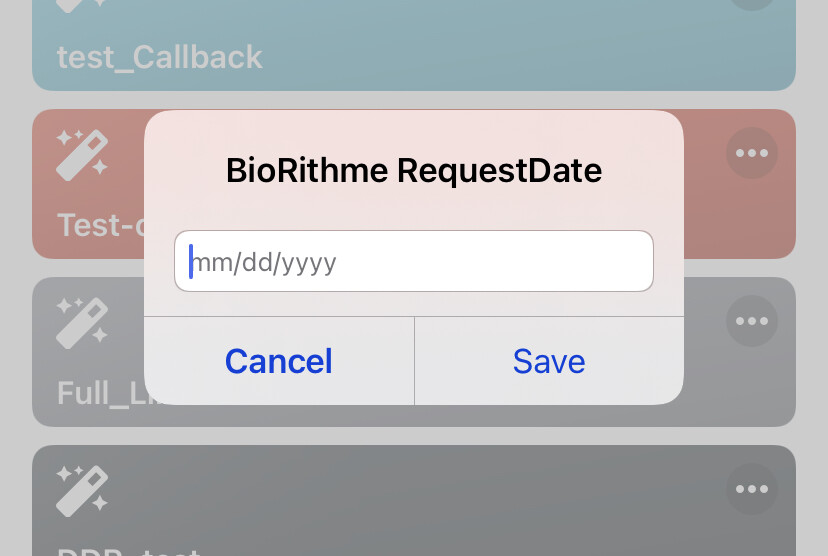
async function editData(data) {
let editor = new Alert()
editor.title = "BioRithme RequestDate"
editor.addTextField(data)
editor.addCancelAction("Cancel")
editor.addAction("Save")
let action = await editor.present()
if (action < 0) {
return data
} else {
return editor.textFieldValue(0)
}
}
Hi, can you share the code with me? 
Thanks so much!
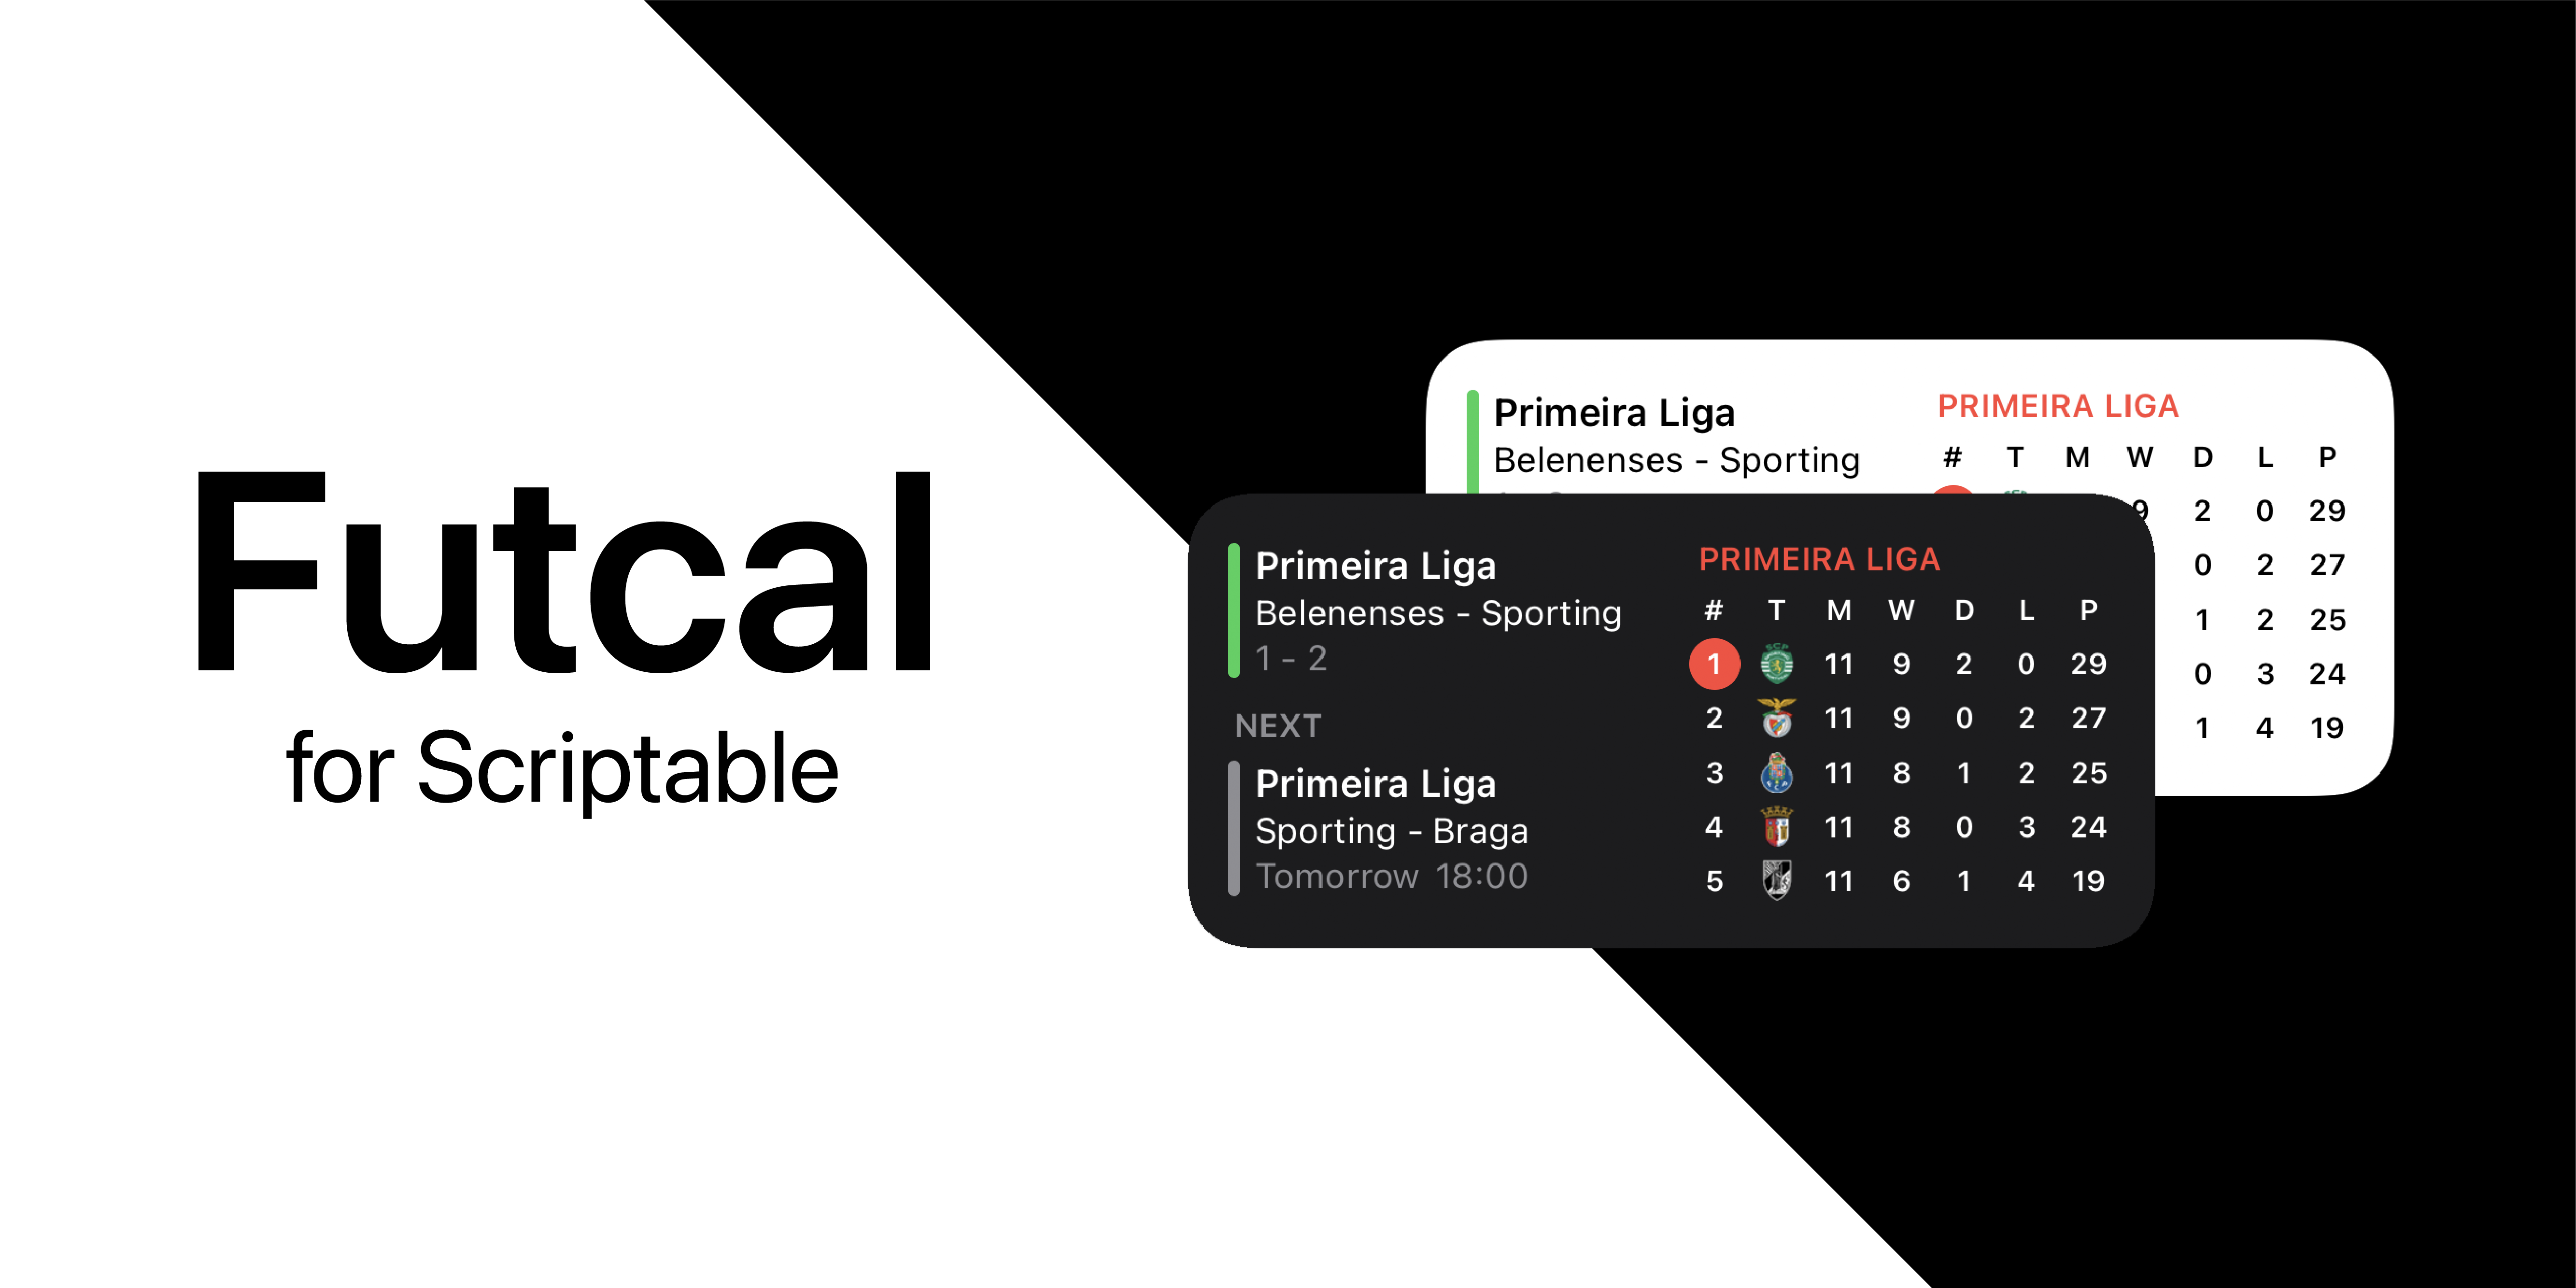
Hi everyone!
I created a simple football widget for Scriptable, please let me have any comments / suggestions!
3 Likes
Put the BioCurves with PartyStars and Backgrounds
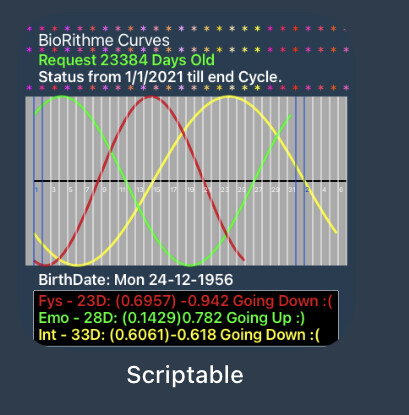
I was looking for adding a Rectangle with rounded corners… well here is the code for it
...

//BackGround of CurveDiagram
//Straigth Corners
//dcRegion.setFillColor(Color.lightGray())
// rect (x,y,w,h)
//dcRegion.fillRect(new Rect(10, 100, 380, 200))

//Round Corners
    const path = new Path()
    path.addRoundedRect(new Rect(10,100, 380, 200), 15, 15)
    dcRegion.addPath(path)
    dcRegion.setFillColor(Color.lightGray())
    dcRegion.fillPath()
...
Results into
Can you help me make it work?
The widget works only in app but not on the homescreen.
Thank you
// start with this
let widget = new ListWidget()
//
widget.setPadding(0, 0, 0, 0)
let imgStack = widget.addStack()
imgStack.setPadding(0, 0, 0, 0)
//
// const bg = importModule("no-background")
// const bgPosition="medium-top"
let backgroundColor = Color.dynamic(new Color("FEFFFE", 1), new Color("1a1b1d", 1))//
// widget.backgroundImage= await bg.getSlice(bgPosition)
// widget.backgroundColor = backgroundColor
//font color
// let fontColor = Color.dynamic(new Color("1a1b1d", 1), new Color("FEFFFE", 1))
let fontColor = new Color("FEFFFE", 1)
// ptCol = fontColor
let textStack = widget.addStack()
textStack.setPadding(5, 0, 0, 5)
await loadSite()
// end with this
if (!config.runsInWidget) widget.presentLarge()
Script.setWidget(widget)
Script.complete()
//
async function getImage(url) {
let req = new Request(url)
return await req.loadImage()
}
async function loadSite() {
let url='https://www.finviz.com'
let wbv = new WebView()
await wbv.loadURL(url)
//javasript to grab data from the website
let jsc = `
var arr = new Array()
const canvas = document.getElementById("treemap-small").getElementsByTagName("canvas")[0]
var dataURL = canvas.toDataURL();
console.log(dataURL);
var theImage = dataURL
arr.push(theImage)
JSON.stringify(arr)
`
//Run the javascript
let jsn = await wbv.evaluateJavaScript(jsc)
//Parse the grabbed values into a variable
let val = JSON.parse(jsn)
//Assign the parts to single variables
let theImageURL = val[0]
let lastUpdated = val[1]
let image = await getImage(theImageURL)
let theImage = imgStack.addImage(image)
// textStack.addSpacer()
// let theText = textStack.addText(lastUpdated)
// theText.font = Font.regularSystemFont(8)
// theText.textColor = fontColor
// theText.textOpacity = 0.7
}
 
Hi,please find the latest version of the code in below link:
Created a widget to monitor my solar panels’ production (and consumption):
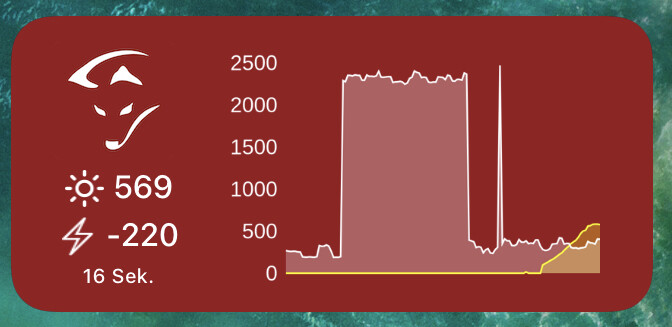
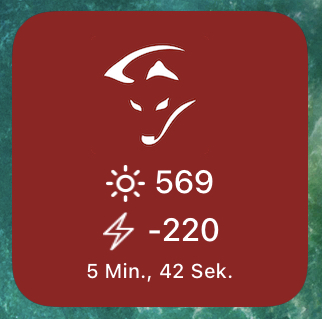
The chart is created using quickchart.io, feeding it live data from SmartFox energy manager.
Is there any way to store some data between runs? I need to authenticate to get access to that data. In the end I implemented a little web service which takes care of managing the session cookie etc. to simplify the widget code.
2 Likes
Hey is there any chance you can share the script for the above widget?
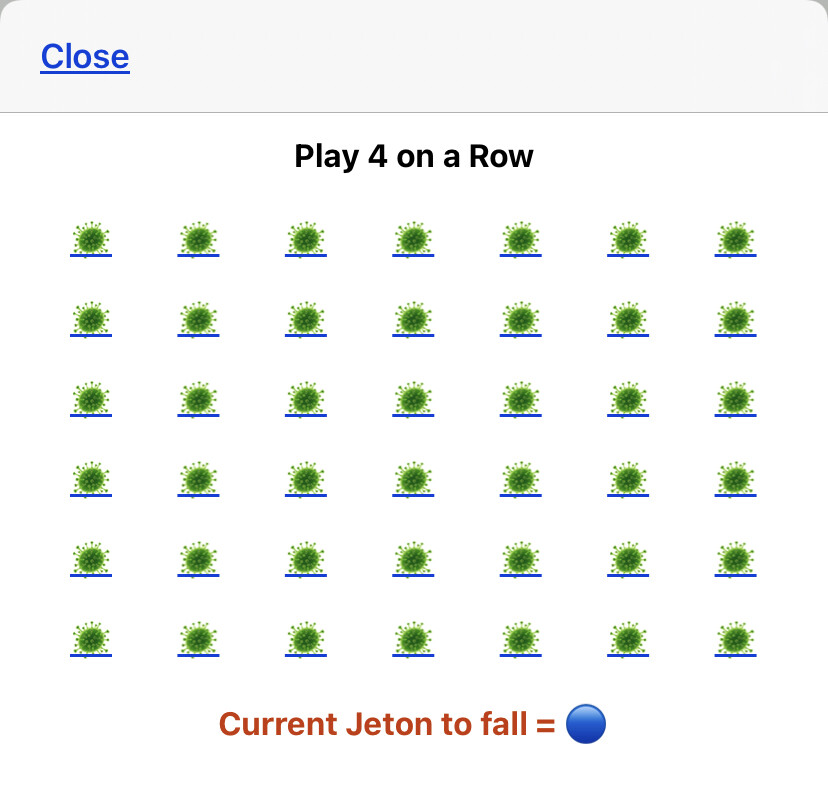
Made the game 4 On a Row… based upon Tic-Tac-Toe
Here is the code… with the Covid Virus😉
const STATE_EMPTY = null
const STATE_PLAYER_ONE = 1
const STATE_PLAYER_TWO = 2
const SE = null
//const SP1=1
//const SP2=2

//=======================================
// Set-up a small widget and drawing region

const widgetHeight = 400
const widgetWidth = 400
const widgetColor="243D52"


let CURRENT_PLAYER = STATE_PLAYER_ONE
let WINNER = null
let HAS_EMPTY_SQUARES = true

let board = [
  [ STATE_EMPTY, STATE_EMPTY, STATE_EMPTY ],
  [ STATE_EMPTY, STATE_EMPTY, STATE_EMPTY ],
  [ STATE_EMPTY, STATE_EMPTY, STATE_EMPTY ]
]

let b7x6=[
[SE,SE,SE,SE,SE,SE,SE],
[SE,SE,SE,SE,SE,SE,SE],
[SE,SE,SE,SE,SE,SE,SE],
[SE,SE,SE,SE,SE,SE,SE],
[SE,SE,SE,SE,SE,SE,SE],
[SE,SE,SE,SE,SE,SE,SE]
]

let table = new UITable()
//updateTable()
updTable()
table.backgroundColor=Color.blue()
table.present()


function updTable() {
table.removeAllRows()

let row = new UITableRow()
row.isHeader = true

let cell = row.addText("Play 4 on a Row")
cell.titleColor = Color.black()
cell.centerAligned()
table.addRow(row)


for (let rn=0;rn< b7x6.length; rn++)
{
let cols = b7x6[rn]
let row = new UITableRow()
row.height=40

for (let cn = 0; cn < cols.length; cn++) {
let state = cols[cn]
let emoji = emojiForSquareState(state)
let cell
      if (state == STATE_EMPTY && WINNER == null && HAS_EMPTY_SQUARES) {
        cell = row.addButton(emoji)
        cell.onTap = () => {
          move(rn, cn)
          checkForWinner()
          //checkIfHasEmptySquares()
          changeCurrentPlayer()
          updTable()
          table.reload()
        }
      } else {
        cell = row.addText(emoji)
      }
      cell.centerAligned()
    }
    table.addRow(row)
  }

row = new UITableRow()
    row.isHeader = true
//
let txt=""
if(CURRENT_PLAYER==1){
txt = "Current Jeton to fall = "+ emojiForSquareState(CURRENT_PLAYER)} else {
txt =emojiForSquareState(CURRENT_PLAYER)+" = Current Jeton to fall"}

cell = row.addText(txt)

    cell.titleColor = Color.orange()
    cell.centerAligned()
    table.addRow(row)

  if (WINNER != null) {
    let row = new UITableRow()
    row.isHeader = true
    let emoji = emojiForSquareState(WINNER)
    let cell = row.addText(emoji + " won!")
    cell.titleColor = new Color("54d132")
    cell.centerAligned()
    table.addRow(row)
}

}

//----------------------------------
function move(rn, cn) {

if(b7x6[5][cn]==SE){
b7x6[5][cn]=CURRENT_PLAYER
return}

if(b7x6[4][cn]==SE)//
{b7x6[4][cn]=CURRENT_PLAYER
return
}

if(b7x6[3][cn]==SE)//
{b7x6[3][cn]=CURRENT_PLAYER
return
}

if(b7x6[2][cn]==SE)//
{b7x6[2][cn]=CURRENT_PLAYER
return
}

if(b7x6[1][cn]==SE)//
{b7x6[1][cn]=CURRENT_PLAYER
return
}

if(b7x6[0][cn]==SE)//
{b7x6[0][cn]=CURRENT_PLAYER
return
}
}
//------------------------------

function changeCurrentPlayer() {
  if (CURRENT_PLAYER == STATE_PLAYER_ONE) {
    CURRENT_PLAYER = STATE_PLAYER_TWO
  } else {
    CURRENT_PLAYER = STATE_PLAYER_ONE
  }
}
//------------------------------
function checkForWinner() {

for (let rn=0;rn<6;rn++){
// horizontal non-null match
for (let c=0;c<4;c++){
if (b7x6[rn][c] !== SE && b7x6[rn][c] === b7x6[rn][c+1] && b7x6[rn][c] === b7x6[rn][c+2] && b7x6[rn][c] === b7x6[rn][c+3]) {
      WINNER = CURRENT_PLAYER
      return
  }
 }
}

for (let cn=0;cn<7;cn++){
// vertical non-null match
for (let r=0;r<3;r++){
if (b7x6[r][cn] !== SE && b7x6[r][cn] === b7x6[r+1][cn] && b7x6[r][cn] === b7x6[r+2][cn] && b7x6[r][cn] === b7x6[r+3][cn]) {
      WINNER = CURRENT_PLAYER
      return
  }
 }
}

for (let rn=3;rn<6;rn++){
//diagonal right
for (let c=0;c<4;c++){
if (b7x6[rn][c] !== SE && b7x6[rn][c] === b7x6[rn-1][c+1] && b7x6[rn][c] === b7x6[rn-2][c+2] && b7x6[rn][c] === b7x6[rn-3][c+3]) {
      WINNER = CURRENT_PLAYER
      return
  }
 }
}

for (let rn=3;rn<6;rn++){
//diagonal left
for (let c=3;c<7;c++){
if (b7x6[rn][c] !== SE && b7x6[rn][c] === b7x6[rn-1][c-1] && b7x6[rn][c] === b7x6[rn-2][c-2] && b7x6[rn][c] === b7x6[rn-3][c-3]) {
      WINNER = CURRENT_PLAYER
      return
  }
 }
}
}

//-----------------------------------


function checkIfHasEmptySquares() {
  let hasEmptySquares = false
  for (let rn = 0; rn < board.length; rn++) {
    let shouldBreak = false
    let cols = board[rn]
    for (let cn = 0; cn < cols.length; cn++) {
      if (board[rn][cn] == STATE_EMPTY) {
        hasEmptySquares = true
        shouldBreak = true
        break
      }
    }
    if (shouldBreak) {
      break
    }
  }
  HAS_EMPTY_SQUARES = hasEmptySquares
}

function emojiForSquareState(state) {
  if (state == STATE_PLAYER_TWO) {
    return "🔴"
  } else if (state == STATE_PLAYER_ONE) {
    return "🔵"
  } else {
    return "🦠"
  }
}
Are you asking about the SmartFox widget? If so: how technical are you? As I said: a lot of the heavy lifting is done in a little web service I wrote (in NodeJS)…
Another widget for Germany displaying to quota of given vaccinations to the population according to data published by the RKI and made available by https://api.corona-zahlen.org.
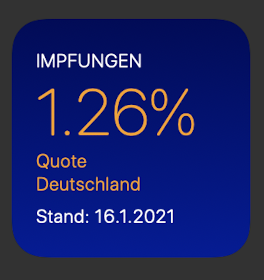
Source available here:
As of today the API is not working properly (TLS certificate invalid). Let’s see, if this changes in future …
Update: API is up again.
Are the buttons available now in the appstore version?
@mherger - that’s fine  we can work out what we need from the code.
Hi @Kendo & @Tristb45 - I’m wondering whether I simply don’t understand how this forum is supposed to work… but could you please be a bit more clear about what you’re interested in from what I posted? Are you using a SmartFox?
@mherger, take a look at who those individuals are replying to in the threads. It is shown in the top right of their post. I do not think that they are replying to you … but it is difficult to follow the threads of conversation in this topic.
Rather than posting about new widgets to this thread, a better approach is to post to its own thread. It makes the conversation a lot easier to follow. Some time back, @RosemaryOrchard split out a number of widget entries that were generating a lot of discussion, but as you can see, trying to follow the divergent conversation on a single forum topic isn’t easy, and at over 500 posts, it is difficult for people to find an entry of interest and its latest iteration without having to read the thread end-to-end.
Can’t believe I missed this functionality of scriptable. Perfect for building dashboards. But how often is it run? And any way to control it?
See the answers on this thread about the topic.
1 Like
Users have no real control over that as far as I can tell.
I think my Scriptable widgets are a little faster to reload if I go into Scriptable to edit them, but I’m not convinced it’s terribly predictable.
1 Like