That looks great! Do you mind sharing the code for the pressure info?
Also, do you know how can I change the location and weather description font type? I’d like to change it to system rounded. Thanks
That looks great! Do you mind sharing the code for the pressure info?
Also, do you know how can I change the location and weather description font type? I’d like to change it to system rounded. Thanks
Thanks for this. The clear layout and comments of your code are helping me feel more confident with tweaking things. Great effort!
This is the used owm-API url.
Edit: Oops. Of cause, you need to put your key at the end of it 
You might paste the content at jsonlint to display it more readable.
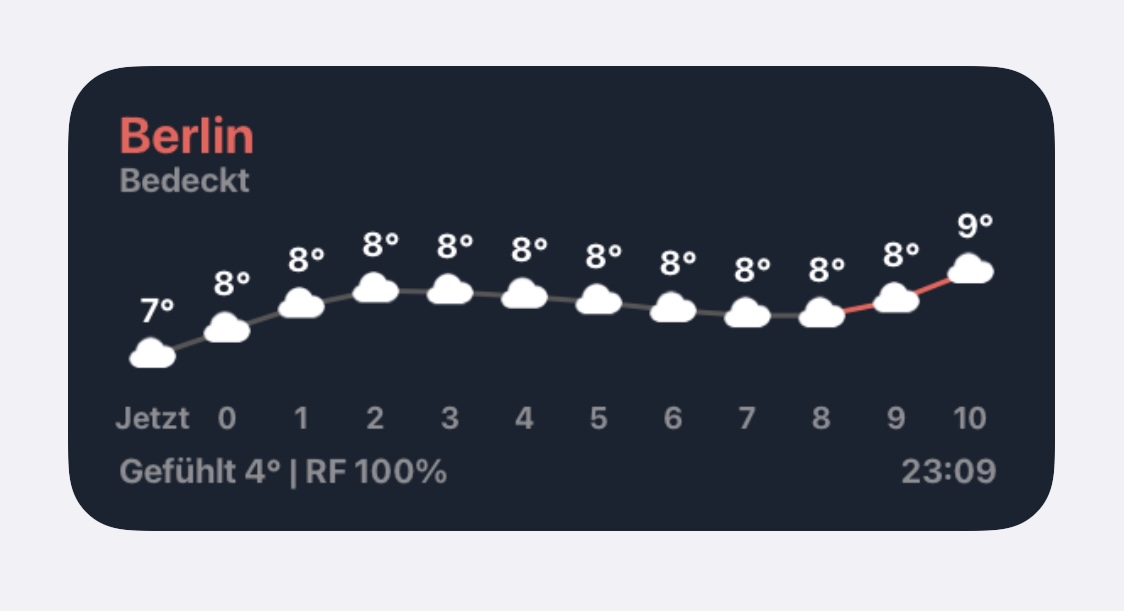
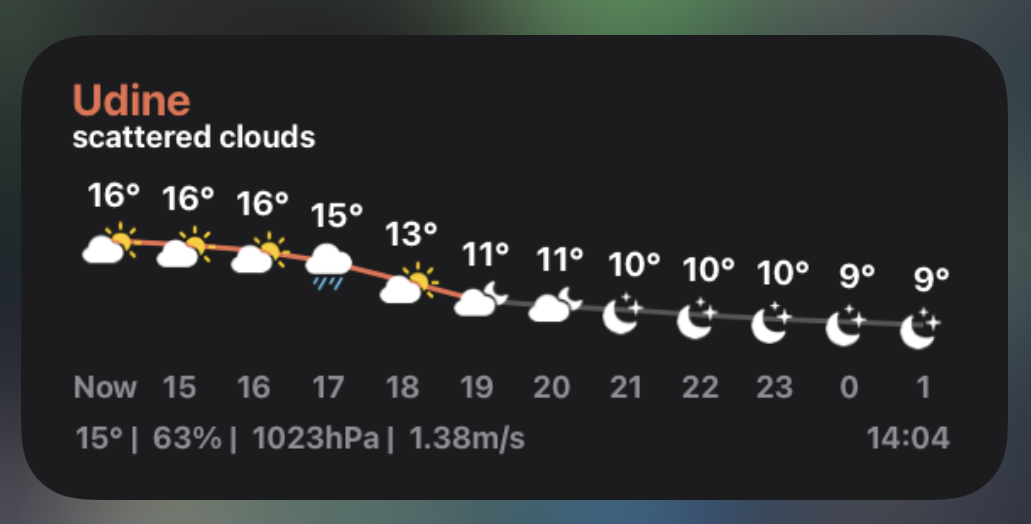
Think I got it showing the red line between sunset and midnight now (this was from 23:09):
OWM doesn’t provide sunrise/sunset data for the next day, so I cheated a bit and made it add one day to today’s sunrise/sunset timestamps - just for the time from sunset to midnight. From midnight to sunset it still uses current timestamps.
I’ll watch it some time to make sure it’s performing as supposed to and will post the tweaks if I think it does.
It’s easier to upload all the code: https://gist.github.com/giuliomagnifico/efd3ecd628a96d714e840c98ac77463f
Add
const pressure = "" //here if you want to set a name for the pressure
And change the line 153 to this
drawText(feelsstring + " " + Math.round(weatherData.current.feels_like) + "° | " + relHumidity + " " + weatherData.current.humidity + "% | " + pressure + " " + weatherData.current.pressure + " hPa", footerFontSize, feelsLikeCoords.x, feelsLikeCoords.y, Color.gray())
About the font you have to change line 62 and 68 with your font.
Thanks a lot for the OWM api URL, I was searching in the API docs on OWM site but now it’s easier. Probably I was wrong because I was calling “windspeed” instead of “wind_speed”. Torrow i’ll try again!
For me the red line doesn’t work for the sunrise  It appears just after the 00:00 like you said before, If you find a solution share it please!
Yeah, within code it looks kind of chopped up, just have a look at the request call, i.e.:
weatherData = await new Request("https://api.openweathermap.org/data/2.5/onecall?lat=" + LAT + "&lon=" + LON + "&exclude=daily,minutely,alerts&units=" + units + "&lang=" + locale + "&appid=" + API_KEY).loadJSON();
All the + Anything + stuff are just the variables that was declared before. If you take all the quotes away and put your variables in you’ll have an ordinary url.
Yes, with your help, in two minutes I went able to add the wind speed
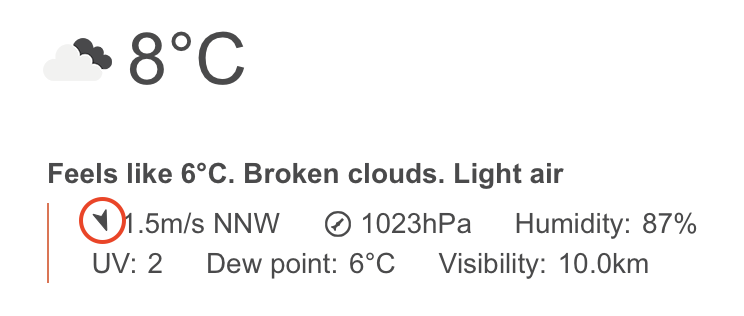
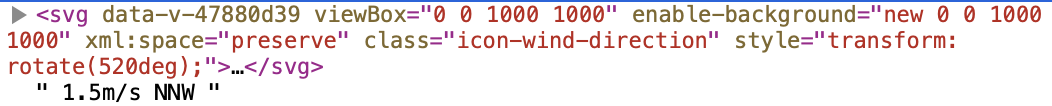
but I’m not able to get the direction icon because is not in the query, there’s only the direction, and the icon doesn’t change regarding to the direction (like the meteo/cloud/sun/…) but is a svg that is rotated in the html. So it’s not simply, impossibile for me that I know nothing of JavaScript
If you have any idea on how to do add this in the script… I know that I can simply add “520 degree” as the direction but it uses 5 letters instead of 1 of the icon, and it’s not nice 
Plus maybe it would be nice to have a gradient on the widget, like this I’m using
But I don’t know how to insert in the weatherline widget, here’s the code:
// Add background gradient
  let gradient = new LinearGradient()
  gradient.locations = [0, 1]
  gradient.colors = [
    new Color("141414"),
    new Color("13233F")
  ]
  widget.backgroundGradient = gradient
Edit: here’s the code with the wind speed. if someone want it
Hmm, you’re right. They are Bézier curves and the control points are overshooting a bit. I will look into toning it down. You could try adjusting the smoothing constant, for one.
Hmm, personally I don’t care too much about displaying wind values but I think I’d prefer using an SFSymbol as well. Of cause there’s more than one way, by now I couldn’t find how to set up image roation within Scriptable, maybe someone else could help with that.
Here’s a small topic-related example to play with. It calls windpeed and degrees, displays the SFSymbol ‘location.north’ and adds it to a stack, rotate function still missing:
// Wind Arrow - R&D

const widget = new ListWidget()
const row = widget.addStack()
const API_KEY = "add_your_key_here"
var LAT = 52.45 // change to your latitude
var LON = 13.29 // change to your longitude
const locale = "en"
const units = "metric"
try {
  weatherData = await new Request("https://api.openweathermap.org/data/2.5/onecall?lat=" + LAT + "&lon=" + LON + "&exclude=daily,minutely,alerts&units=" + units + "&lang=" + locale + "&appid=" + API_KEY).loadJSON();
}catch{}

var windSpeed = weatherData.current.wind_speed
var windDeg = weatherData.current.wind_deg

log(windSpeed)
log(windDeg)

row.addText(windSpeed + " ")
windSpeed.textColor = Color.darkGray()
windSpeed.font = Font.systemFont(20)

var stack = row.addStack()
stack.setPadding(4, 4, 0, 0)
// stack.layoutHorizontally()
// stack.centerAlignContent()

// setup SFSymbol, pattern: (SFSymbol name, stack name, color, size, wind_deg number)
addSFS('location.north', stack, Color.darkGray(), 14, windDeg)

widget.presentSmall()

// SFSymbol function
function addSFS(sfs, stk, col, sze, deg) {
  const s = SFSymbol.named(sfs)
  s.applyFont(Font.systemFont(64))
//   s.transform = "rotate(45deg)" // doesn't do
//   deg still to add somewhere
  const a = stk.addImage(s.image)
//   a.transform = "rotate(45deg)" // doesn't do
  a.tintColor = col
  a.imageSize = new Size(sze, sze)
}
Works fine thanks! But without the rotation is not much useful  unfortunately there is no location.south/west/etc… SFSymbol. With other directions symbols it would be much easy.
Anyway I changed some fonts and alignment because with all of these functions, the footer font was to big with 20pt, I set 18pt, bigger and upper city name also:
// Position and size of the elements on the widget.
// All coordinates make reference to the top-left of the element.
// locationNameCoords : Point > Define the position in pixels of the location label.
const locationNameCoords = new Point(30, 26)
// locationNameFontSize : number > Size in pixels of the font of the location label.
const locationNameFontSize = 26
// weatherDescriptionCoords : Point > Position of the weather description label in pixels.
const weatherDescriptionCoords = new Point(30, 52)
// weatherDescriptionFontSize : number > Font size of the weather description label.
const weatherDescriptionFontSize = 18
//footerFontSize : number > Font size of the footer labels (feels like... and last update time).
const footerFontSize = 18
//feelsLikeCoords : Point > Coordinates of the "feels like" label.
const feelsLikeCoords = new Point(28, 230)
I thinks now the big (4x2) widget looks a bit better, with the small one (2x2) I’m only using the feels like + relative humidity.
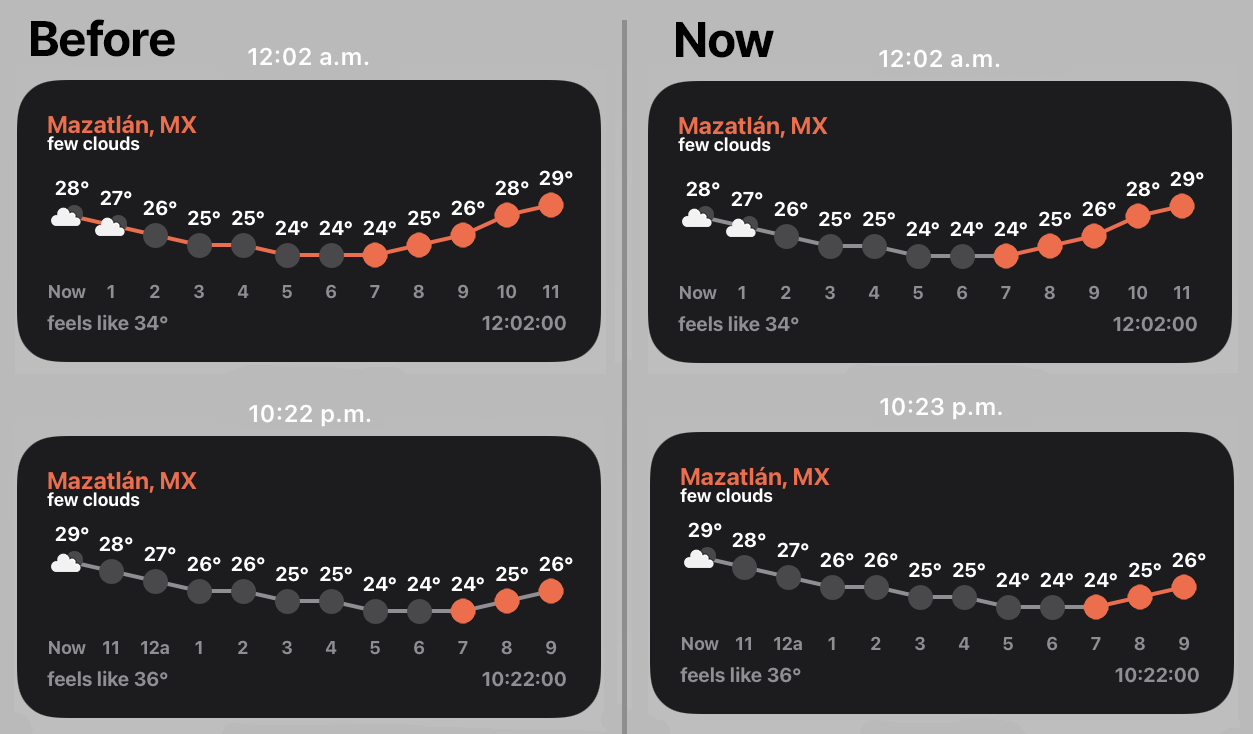
Yep, I am aware of this bug (the line color), and already fixed it but I haven’t uploaded the fix, I will do it in a moment.
Wow, I’m somewhat curious to see how you attempted that. This almost made my head blast.
I have some kind-of-fix with altered sunrise/sunset values to use after sunset. But I think this will fail in summer, when the next sunrise date appears on the line graph before the current day’s sunset passed. Tricky topic, so easy to overlook logical details…
@egamez Well wow. That is some elegant code.
Edit: &exclude=daily 
Updated the weather widget on the Gist.
Added:
 symbol when there is not internet connection when trying to update.
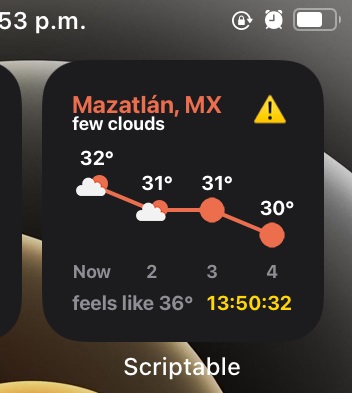
Fixed:
 .
.I wanted to draw the offline symbol with an SFSymbol, but when drawing the symbol image into a DrawContext, it shows black, and can’t be tinted, only when added directly to the ListWidget you can change the color (@simonbs  ), and I was waiting for a way to do it, to release this fix update.
I didn’t saw anybody noticing the line color bug tho, until now @eqsOne, so here is it  .
.
@egamez Awesome code. Thanks for sharing!
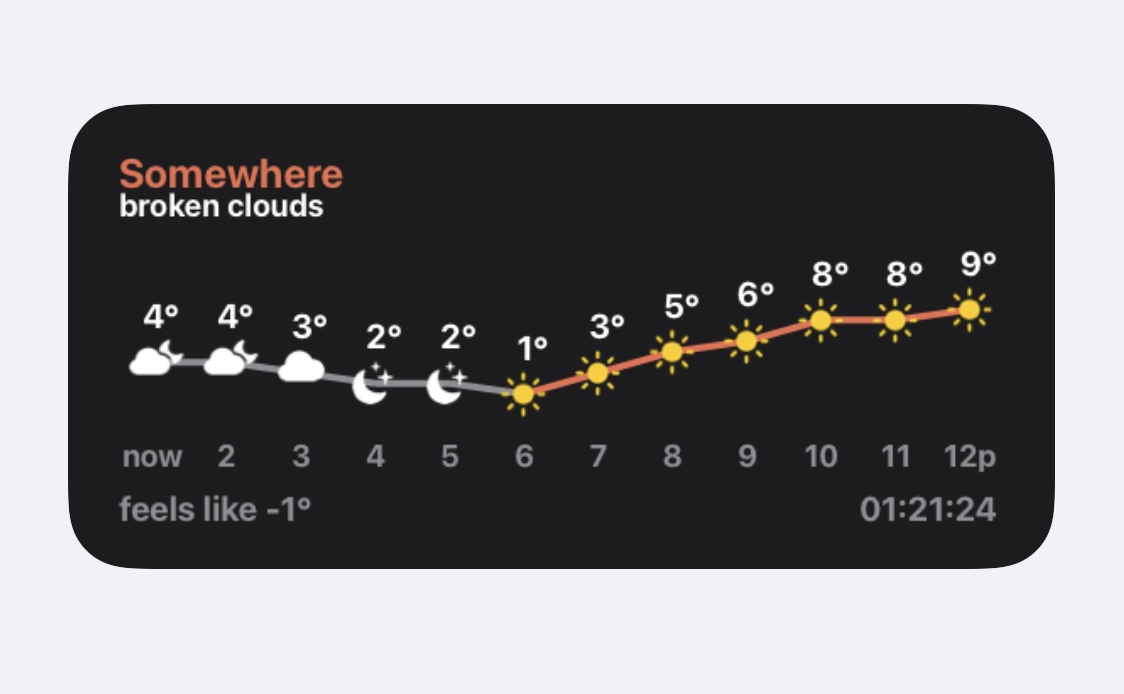
To those who prefer the SFSymbol version, here’s the beauty with an adapted version of @mzeryck’s tweak applied.
// Variables used by Scriptable.
// These must be at the very top of the file. Do not edit.
// icon-color: yellow; icon-glyph: cloud;

// Widget Params
// Don't edit this, those are default values for debugging (location for Cupertino).
// You need to give your locations parameters through the widget params, more info below.
const widgetParams = JSON.parse((args.widgetParameter != null) ? args.widgetParameter : '{ "LAT" : "37.32" , "LON" : "-122.03" , "LOC_NAME" : "Cupertino, US" }')

// WEATHER API PARAMETERS !important
// API KEY, you need an Open Weather API Key
// You can get one for free at: https://home.openweathermap.org/api_keys (account needed).
const API_KEY = ""
// Latitude and Longitude of the location where you get the weather of.
// You can get those from the Open Weather website while searching for a city, etc.
// This values are getted from the widget parameters, the widget parameters is a JSON string that looks like this:
// { "LAT" : "<latitude>" , "LON" : "<longitude>" , "LOC_NAME" : "<name to display>" }
// This to allow multiple instances of the widget with different locations, if you will only use one instance (1 widget), you can "hardcode" the values here.
// Note: To debug the widget you need to place the values here, because when playing the script in-app the widget parameters are null (= crash).
// Hardcoded Location, type in your latitude/longitude values and location name
var LAT = widgetParams.LAT // 12.34
var LON = widgetParams.LON // 12.34
var LOCATION_NAME = widgetParams.LOC_NAME // "Your place"
// Looking settings
// This are settings to customize the looking of the widgets, because this was made an iPhone SE (2016) screen, I can't test for bigger screens.
// So feel free to modify this to your taste.
// Support locales
const locale = "en" // "fr" "it" "de" etc. for weather description language
const nowstring = "now" // Your local term for "now"
const feelsstring = "feels like" //Your local term for "feels like"
// units : string > Defines the unit used to measure the temps, for temperatures in Fahrenheit use "imperial", "metric" for Celcius and "standard" for Kelvin (Default: "metric").
const units = "metric"
// twelveHours : true|false > Defines if the hours are displayed in a 12h format, use false for 24h format. (Default: true)
const twelveHours = true
// roundedGraph : true|false > true (Use rounded values to draw the graph) | false (Draws the graph using decimal values, this can be used to draw an smoother line).
const roundedGraph = true
// roundedTemp : true|false > true (Displays the temps rounding the values (29.8 = 30 | 29.3 = 29).
const roundedTemp = true
// hoursToShow : number > Number of predicted hours to show, Eg: 3 = a total of 4 hours in the widget (Default: 3 for the small widget and 11 for the medium one).
const hoursToShow = (config.widgetFamily == "small") ? 3 : 11;
// spaceBetweenDays : number > Size of the space between the temps in the graph in pixels. (Default: 60 for the small widget and 44 for the medium one).
const spaceBetweenDays = (config.widgetFamily == "small") ? 60 : 44;
// Widget Size !important.
// Since the widget works "making" an image and displaying it as the widget background, you need to specify the exact size of the widget to
// get an 1:1 display ratio, if you specify an smaller size than the widget itself it will be displayed blurry.
// You can get the size simply taking an screenshot of your widgets on the home screen and measuring them in an image-proccessing software.
// contextSize : number > Height of the widget in screen pixels, this depends on you screen size (for an 4 inch display the small widget is 282 * 282 pixels on the home screen)
const contextSize = 282
// mediumWidgetWidth : number > Width of the medium widget in pixels, this depends on you screen size (for an 4 inch display the medium widget is 584 pixels long on the home screen)
const mediumWidgetWidth = 584
// accentColor : Color > Accent color of some elements (Graph lines and the location label).
const accentColor = new Color("#EB6E4E", 1)
// backgroundColor : Color > Background color of the widgets.
const backgroundColor = new Color("#1C1C1E", 1)
// Position and size of the elements on the widget.
// All coordinates make reference to the top-left of the element.
// locationNameCoords : Point > Define the position in pixels of the location label.
const locationNameCoords = new Point(30, 30)
// locationNameFontSize : number > Size in pixels of the font of the location label.
const locationNameFontSize = 24
// weatherDescriptionCoords : Point > Position of the weather description label in pixels.
const weatherDescriptionCoords = new Point(30, 52)
// weatherDescriptionFontSize : number > Font size of the weather description label.
const weatherDescriptionFontSize = 18
//footerFontSize : number > Font size of the footer labels (feels like... and last update time).
const footerFontSize = 20
//feelsLikeCoords : Point > Coordinates of the "feels like" label.
const feelsLikeCoords = new Point(30, 230)
//lastUpdateTimePosAndSize : Rect > Defines the coordinates and size of the last updated time label.
const lastUpdateTimePosAndSize = new Rect((config.widgetFamily == "small") ? 150 : 450, 230, 100, footerFontSize+1)
/** From here proceed with caution. **/
// Set up cache. File located in the Scriptable iCloud folder
let fm = FileManager.iCloud();
let cachePath = fm.joinPath(fm.documentsDirectory(), "weatherCache"); // <- file name
if(!fm.fileExists(cachePath)){
fm.createDirectory(cachePath)
}
let weatherData;
let usingCachedData = false;
let drawContext = new DrawContext();
drawContext.size = new Size((config.widgetFamily == "small") ? contextSize : mediumWidgetWidth, contextSize)
drawContext.opaque = false
drawContext.setTextAlignedCenter()
try {
weatherData = await new Request("https://api.openweathermap.org/data/2.5/onecall?lat=" + LAT + "&lon=" + LON + "&exclude=minutely,alerts&units=" + units + "&lang" + locale + "&appid=" + API_KEY).loadJSON();
fm.writeString(fm.joinPath(cachePath, "lastread"+"_"+LAT+"_"+LON), JSON.stringify(weatherData));
}catch(e){
console.log("Offline mode")
try{
await fm.downloadFileFromiCloud(fm.joinPath(cachePath, "lastread"+"_"+LAT+"_"+LON));
let raw = fm.readString(fm.joinPath(cachePath, "lastread"+"_"+LAT+"_"+LON));
weatherData = JSON.parse(raw);
usingCachedData = true;
}catch(e2){
console.log("Error: No offline data cached")
}
}
let widget = new ListWidget();
widget.setPadding(0, 0, 0, 0);
widget.backgroundColor = backgroundColor;
drawText(LOCATION_NAME, locationNameFontSize, locationNameCoords.x, locationNameCoords.y, accentColor);
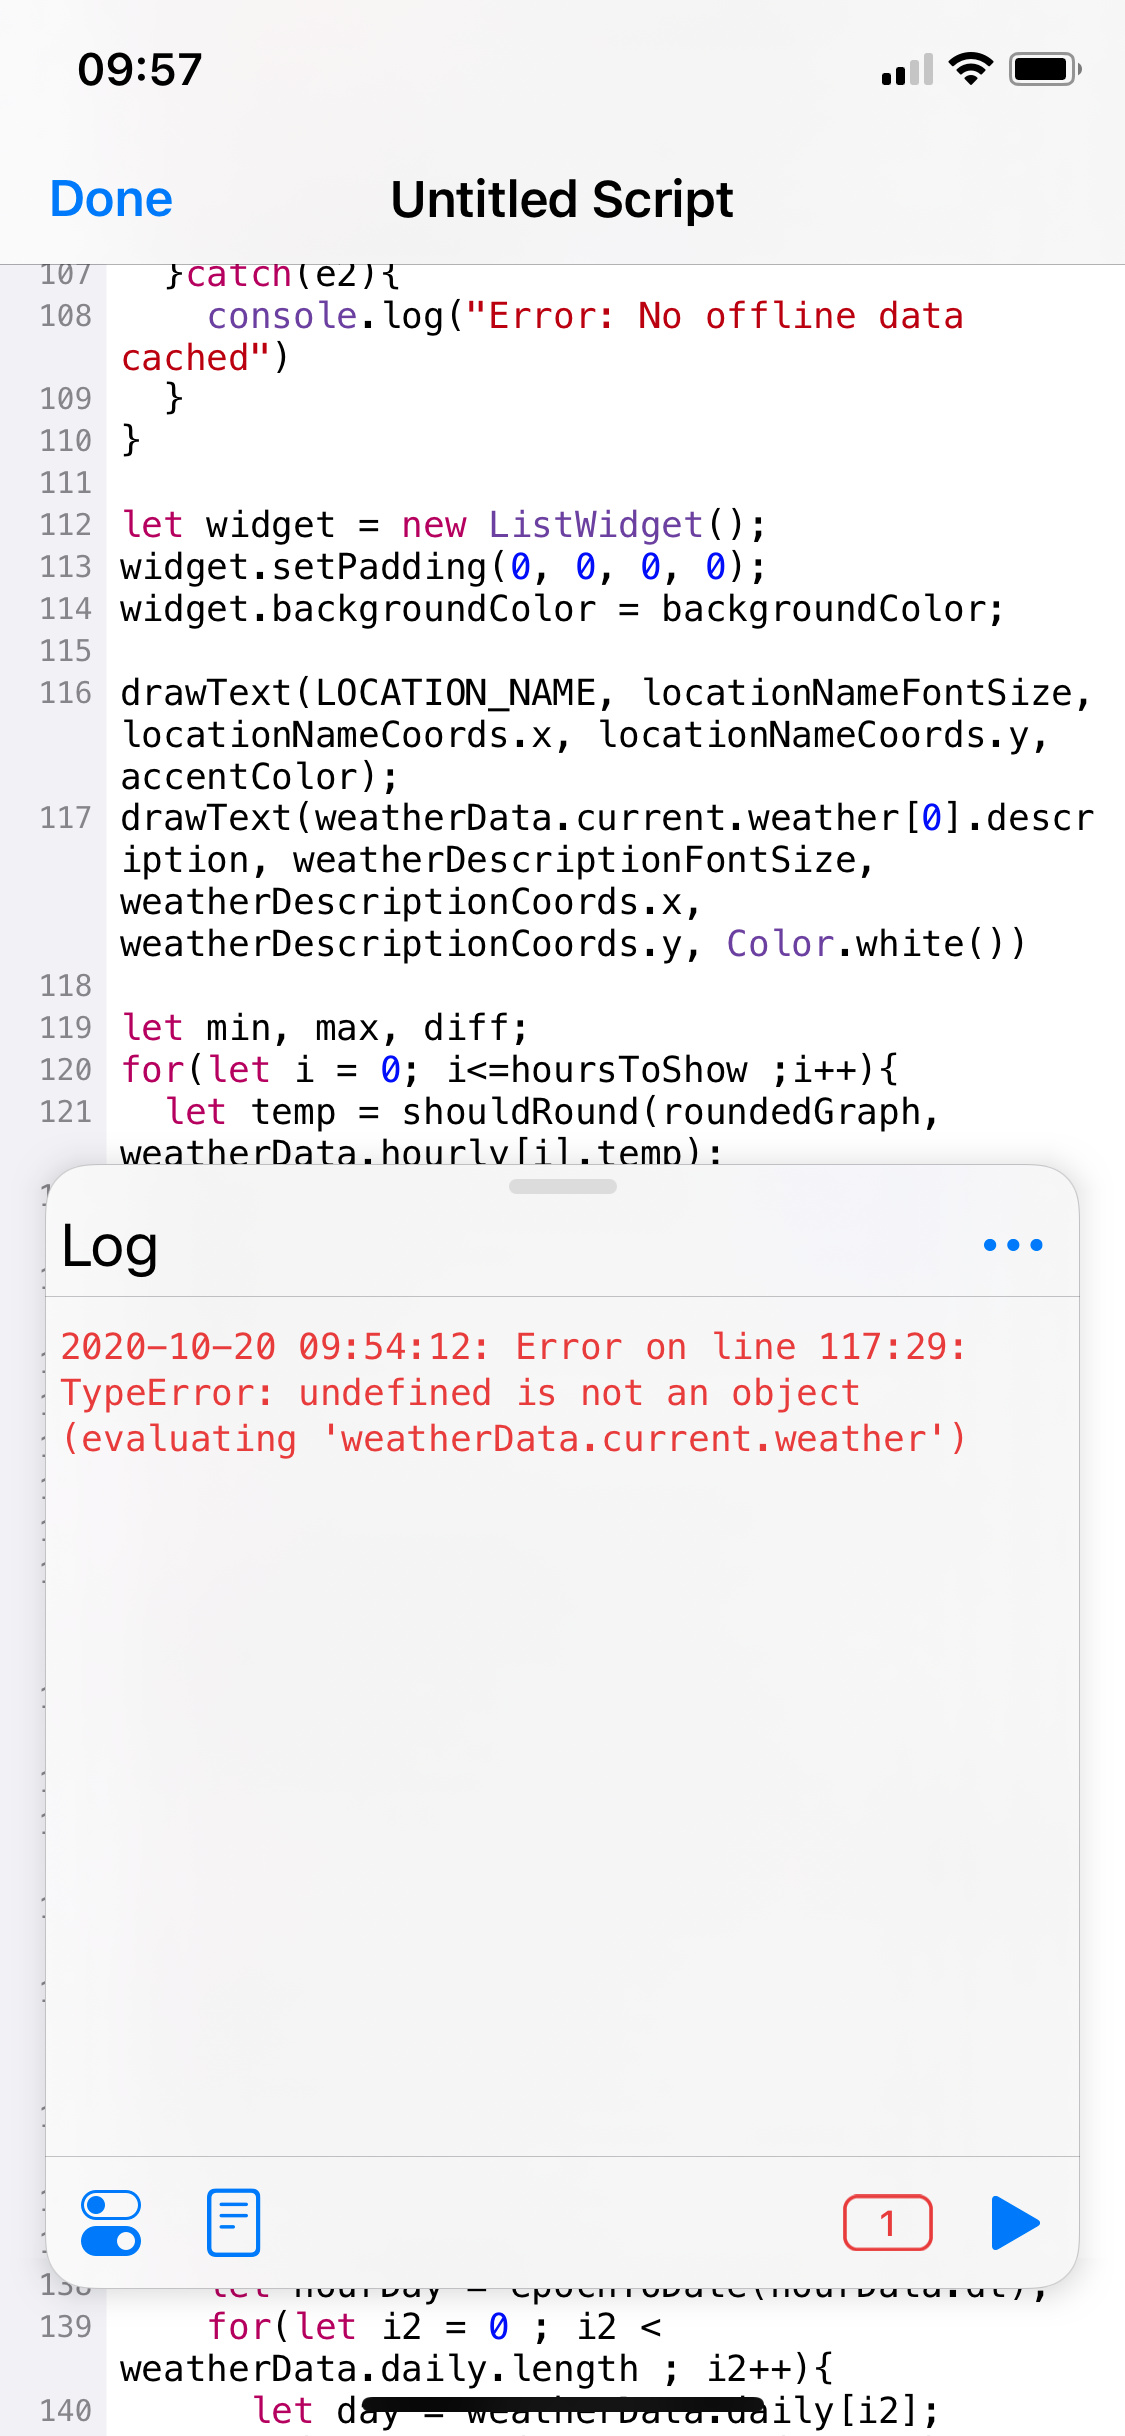
drawText(weatherData.current.weather[0].description, weatherDescriptionFontSize, weatherDescriptionCoords.x, weatherDescriptionCoords.y, Color.white())
let min, max, diff;
for(let i = 0; i<=hoursToShow ;i++){
let temp = shouldRound(roundedGraph, weatherData.hourly[i].temp);
min = (temp < min || min == undefined ? temp : min)
max = (temp > max || max == undefined ? temp : max)
}
diff = max -min;
for(let i = 0; i<=hoursToShow ;i++){
let hourData = weatherData.hourly[i];
let nextHourTemp = shouldRound(roundedGraph, weatherData.hourly[i+1].temp);
let hour = epochToDate(hourData.dt).getHours();
if(twelveHours)
hour = (hour > 12 ? hour - 12 : (hour == 0 ? "12a" : ((hour == 12) ? "12p" : hour)))
let temp = i==0?weatherData.current.temp : hourData.temp
let delta = (diff>0)?(shouldRound(roundedGraph, temp) - min) / diff:0.5;
let nextDelta = (diff>0)?(nextHourTemp - min) / diff:0.5
if(i < hoursToShow){
let hourDay = epochToDate(hourData.dt);
for(let i2 = 0 ; i2 < weatherData.daily.length ; i2++){
let day = weatherData.daily[i2];
if(isSameDay(epochToDate(day.dt), epochToDate(hourData.dt))){
hourDay = day;
break;
}
}
// 'Night' boolean for line graph and SFSymbols
var night = (hourData.dt > hourDay.sunset || hourData.dt < hourDay.sunrise)
drawLine(spaceBetweenDays * (i) + 50, 175 - (50 * delta),spaceBetweenDays * (i+1) + 50 , 175 - (50 * nextDelta), 4, (night ? Color.gray() : accentColor))
}
drawTextC(shouldRound(roundedTemp, temp)+"°", 20, spaceBetweenDays*i+30, 135 - (50*delta), 50, 21, Color.white())
// Next 2 lines SFSymbols tweak
const condition = i==0?weatherData.current.weather[0].id:hourData.weather[0].id
drawImage(symbolForCondition(condition), spaceBetweenDays * i + 34, 161 - (50*delta)); //40, 165
drawTextC((i==0?nowstring:hour), 18, spaceBetweenDays*i+25, 200,50, 21, Color.gray())
previousDelta = delta;
}
drawText(feelsstring + " " + Math.round(weatherData.current.feels_like) + "°", footerFontSize, feelsLikeCoords.x, feelsLikeCoords.y, Color.gray())
drawContext.setTextAlignedRight();
drawTextC(epochToDate(weatherData.current.dt).toLocaleTimeString(), footerFontSize, lastUpdateTimePosAndSize.x, lastUpdateTimePosAndSize.y, lastUpdateTimePosAndSize.width, lastUpdateTimePosAndSize.height, (usingCachedData) ? Color.yellow() : Color.gray())
if(usingCachedData)
drawText("⚠️", 32, ((config.widgetFamily == "small") ? contextSize : mediumWidgetWidth)-72,30)
widget.backgroundImage = (drawContext.getImage())
widget.presentMedium()
function epochToDate(epoch){
return new Date(epoch * 1000)
}
function drawText(text, fontSize, x, y, color = Color.black()){
drawContext.setFont(Font.boldSystemFont(fontSize))
drawContext.setTextColor(color)
drawContext.drawText(new String(text).toString(), new Point(x, y))
}
function drawImage(image, x, y){
drawContext.drawImageAtPoint(image, new Point(x, y))
}
function drawTextC(text, fontSize, x, y, w, h, color = Color.black()){
drawContext.setFont(Font.boldSystemFont(fontSize))
drawContext.setTextColor(color)
drawContext.drawTextInRect(new String(text).toString(), new Rect(x, y, w, h))
}
function drawLine(x1, y1, x2, y2, width, color){
const path = new Path()
path.move(new Point(x1, y1))
path.addLine(new Point(x2, y2))
drawContext.addPath(path)
drawContext.setStrokeColor(color)
drawContext.setLineWidth(width)
drawContext.strokePath()
}
function shouldRound(should, value){
return ((should) ? Math.round(value) : value)
}
function isSameDay(date1, date2){
return (date1.getYear() == date2.getYear() && date1.getMonth() == date2.getMonth() && date1.getDate() == date2.getDate())
}
// SFSymbol function
function symbolForCondition(cond){
let symbols = {
// Thunderstorm
"2": function(){
return "cloud.bolt.rain.fill"
},
// Drizzle
"3": function(){
return "cloud.drizzle.fill"
},
// Rain
"5": function(){
return (cond == 511) ? "cloud.sleet.fill" : "cloud.rain.fill"
},
// Snow
"6": function(){
return (cond >= 611 && cond <= 613) ? "cloud.snow.fill" : "snow"
},
// Atmosphere
"7": function(){
if (cond == 781) { return "tornado" }
if (cond == 701 || cond == 741) { return "cloud.fog.fill" }
return night ? "cloud.fog.fill" : "sun.haze.fill"
},
// Clear and clouds
"8": function(){
if (cond == 800) { return night ? "moon.stars.fill" : "sun.max.fill" }
if (cond == 802 || cond == 803) { return night ? "cloud.moon.fill" : "cloud.sun.fill" }
return "cloud.fill"
}
}
// Get first condition digit.
let conditionDigit = Math.floor(cond / 100)
// Style and return the symbol.
let sfs = SFSymbol.named(symbols[conditionDigit]())
sfs.applyFont(Font.systemFont(25))
return sfs.image
}
Script.complete()
Really good job. Thanks for sharing!
Missing API key in thge beginning of the script
Great eqsOne and egamez  Thanks a lot to both!
EDIT, Sorry I was too lazy but I’ve done by myself
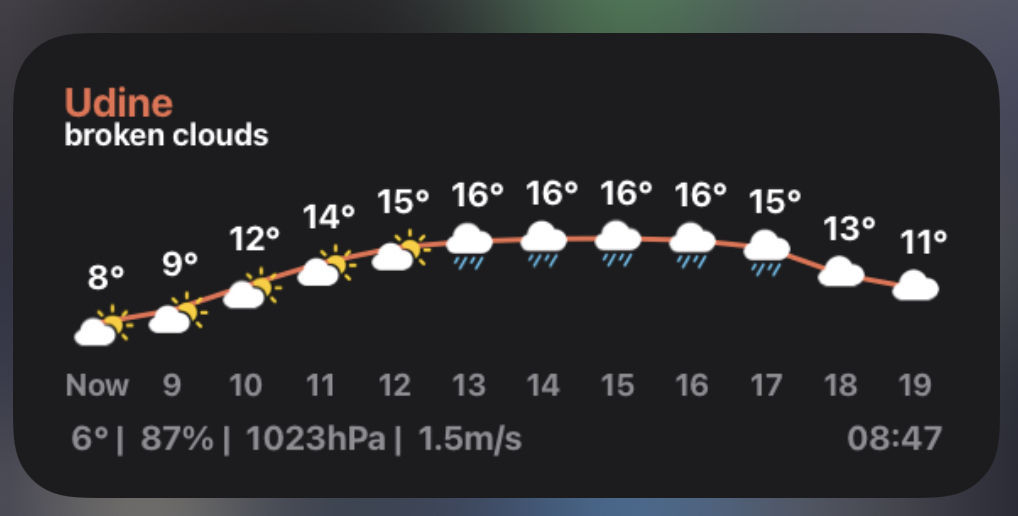
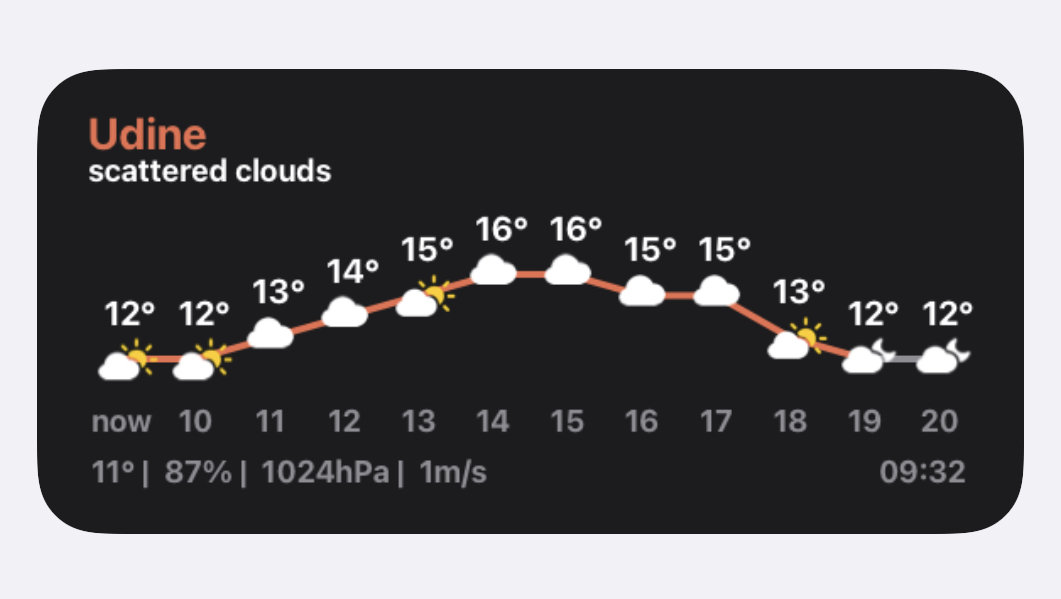
Here’s my version with more data and different fonts size/alignment, 24h etcc., hope it’s okay!
(PS: I removed my API key, thanks to js_learner that noticed it to me, oh and I’ve deleted the old key, you can’t steal my query to the API anymore  )
)
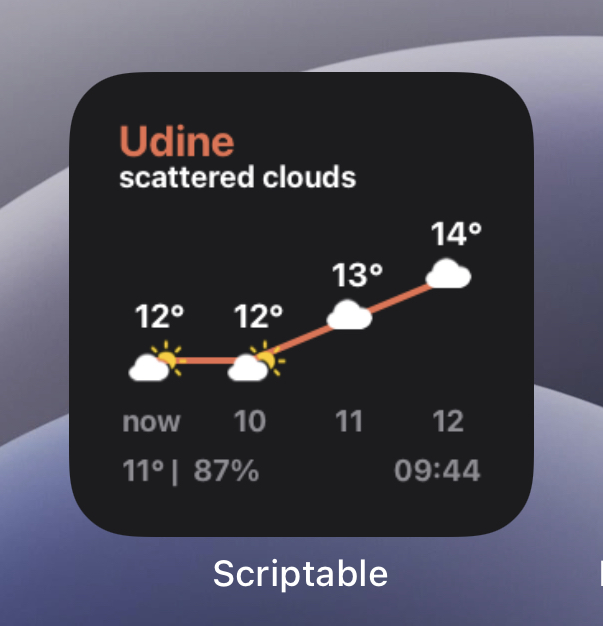
Oh, if someone want it, I’m also using a compact version of it on my homescreen, with only the feels like and humidity.
Just change line 165 to
drawText(feelsstring + " " + Math.round(weatherData.current.feels_like) + "° | " + relHumidity + " " + weatherData.current.humidity + "%", footerFontSize, feelsLikeCoords.x, feelsLikeCoords.y, Color.gray())